![]()
Tech Stocks Down
Submitted by The Blakeley Group, Inc. on March 2nd, 2025THIS WEEK IN THE MARKETS U.S. MARKET INDEXES OVERVIEW
Tech stocks down this week:
Stocks ended a volatile week mostly lower, with the Nasdaq Composite seeing a sharp drop on Monday as AI competition fears weighed on tech shares, particularly NVIDIA, which fell nearly 17% following the debut of DeepSeek’s energy-efficient large language model. Despite concerns, the Dow managed a modest gain, marking its third consecutive week of increases. Earnings season continued, with companies representing 40% of the S&P 500’s market cap reporting results; strong performances from Meta and Apple provided a late-week boost, helping indexes recover some losses. Meanwhile, political developments also shaped market sentiment as President Trump reaffirmed plans for 25% tariffs on Mexico and Canada by February 1, along with a potential 10% tariff on Chinese goods, dashing earlier investor hopes for a softer trade stance.
Research provided by Sherman & Co., LLC.
DOW & TECH
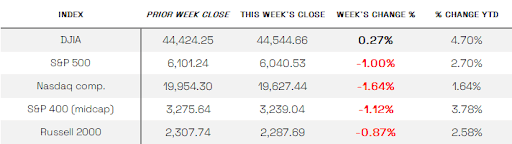
- THE DOW JONES INDUSTRIAL AVERAGE (DJIA) is the oldest continuing U.S. market index with over 100 years of history and is made up of 30 highly reputable “blue-chip” U.S. stocks (e.g. Coca-Cola Co., Microsoft).
The Dow ended the week up 0.27% at 44,544.66 vs the prior week of 44,424.25.
- THE NASDAQ COMPOSITE INDEX tracks most of the stocks listed on the Nasdaq Stock Market - the second-largest stock exchange in the world. Over half of all stocks on the NASDAQ are tech stocks.
The tech-driven Nasdaq ended the week down 1.64%, closing at 19,627.44 vs. the prior week of 19,954.30.
SMALL, MEDIUM, & LARGE CAP
- THE S&P 500 LARGE-CAP INDEX is a market-capitalization-weighted index of 500 leading publicly traded companies in the U.S. The S&P 500 is regarded as one of the best gauges of prominent American equities' performance, and by extension, that of the stock market overall.
The S&P 500 ended the week down 1.00%, closing at 6040.53 compared to last week’s 6101.24.
- THE S&P 400 MID-CAP INDEX is the benchmark index made up of 400 stocks that broadly represent companies with midrange market capitalization between $3.6 billion and $13.1 billion. It is used by investors as a gauge for market performance and directional trends in U.S. stocks.
The S&P 400 mid-cap ended the week down 1.12%, closing at 3239.04 compared to last week’s 3275.64.
- THE RUSSELL 2000 (RUT) SMALL-CAP INDEX measures the performance of the 2,000 smaller companies included in the Russell 3000 Index. The Russell 2000 is managed by London's FTSE Russell Group and is widely regarded as a leading indicator of the U.S. economy because of its focus on smaller companies that focus on the U.S. market.
The Russell 2000 ended the week down 0.87%, closing at 2287.69 compared to last week’s 2307.74.
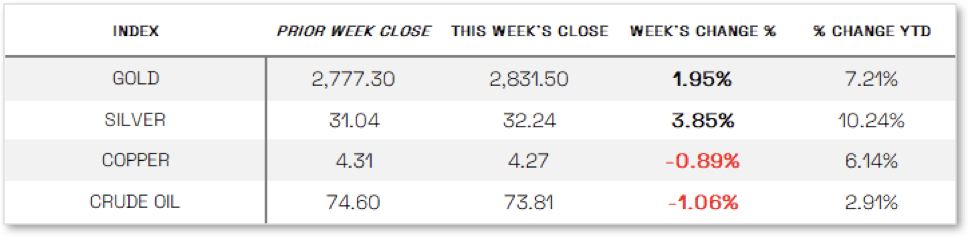
U.S. COMMODITIES / FUTURES OVERVIEW
Research provided by Sherman & Co., LLC.
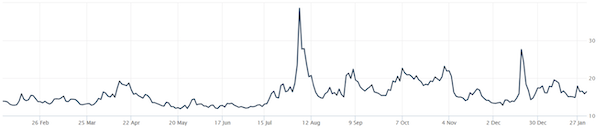
THE VOLATILIY INDEX for 2024 (VIX)
VIX closed at 16.43 this week, a 10.6% increase vs last week’s close of 14.85
Research provided by Sherman & Co., LLC.
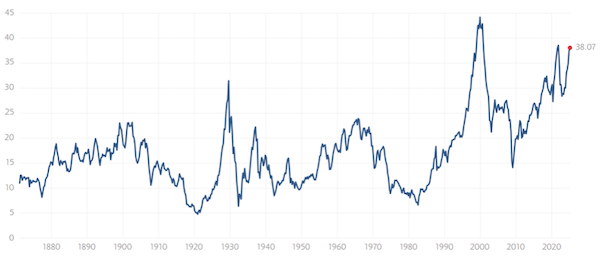
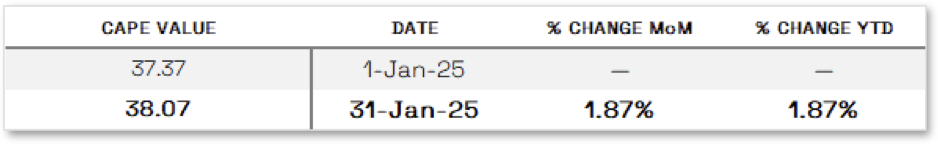
NOTE: WE DO NOT USE CAPE AS AN OFFICIAL INPUT INTO OUR METHODS. HOWEVER, WE THINK HISTORY SERVES AS A GUIDE AND THAT IT’S GOOD TO KNOW WHERE WE ARE ON THE HISTORIC CONTINUUM. *SEE FOOTNOTES FOR MORE INFORMATION ON CAP
THE CAPE Ratio: 38.07
The 10-year CAGR of the Market with CAPE values between 30 and 40 is -0.3%
Research provided by Sherman & Co., LLC.
Research provided by Sherman & Co., LLC.
THIS WEEK’S ECONOMIC NEWS For USA
Fed holds rates steady:
The Federal Reserve held its policy rate steady at 4.25% to 4.50% following its first 2025 meeting, citing solid economic growth, a strong labor market, and persistently elevated inflation. Fed Chair Jerome Powell emphasized that policymakers are in no rush to adjust rates and would need to see significant progress on inflation or labor market weakness before considering cuts. Supporting this stance, the Commerce Department reported that core PCE inflation, the Fed’s preferred measure, remained at 2.8% year over year in December, well above the 2% target. Additionally, U.S. GDP grew at an annualized 2.3% in the fourth quarter and 2.8% for the full year, slightly below expectations but exceeding the Fed’s long-run forecast, driven by consumer and government spending.
INTERNATIONAL MARKETS
Research provided by Sherman & Co., LLC.
Europe
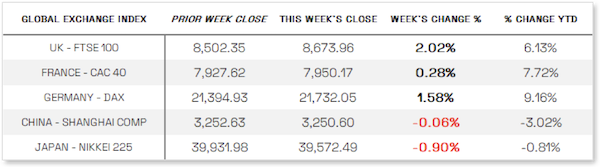
The pan-European STOXX Europe 600 Index gained 1.78% in local currency, reaching a record high as strong earnings and the European Central Bank’s (ECB) decision to cut interest rates lifted investor sentiment. Germany’s DAX rose 1.58% to a new intraday peak, while Italy’s FTSE MIB and France’s CAC 40 added 0.75% and 0.28%, respectively. The UK’s FTSE 100 climbed 2.02%, supported by a weaker pound. As expected, the ECB cut its key deposit rate by 25 basis points to 2.75%, with President Christine Lagarde affirming that disinflation is on track but refraining from signaling further rate cuts. Meanwhile, the eurozone economy stagnated in Q4, missing expectations, though full-year growth of 0.7% aligned with ECB forecasts. Germany and France saw contractions, Italy’s GDP was flat, and Spain grew 0.8%. Inflation slowed to 1.8% in France, remained at 2.8% in Germany, and accelerated to 2.9% in Spain.
Japan
Japan’s stock markets had a mixed week, with the Nikkei 225 falling 0.90% while the broader TOPIX Index gained 1.37%, as a sell-off in major tech stocks—triggered by concerns over Chinese AI firm DeepSeek—hit Japanese chip companies. Domestic stocks also faced pressure from the Bank of Japan’s (BoJ) hawkish stance, as it raised rates for the third time in a year and revised inflation forecasts upward. BoJ officials reaffirmed their commitment to gradual rate hikes, which helped strengthen the yen to the high end of the JPY 154 range against the U.S. dollar. Meanwhile, the 10-year Japanese government bond yield held steady at 1.23%, near a 14-year high. Economic data showed Tokyo’s core consumer price index rose 2.5% year over year in January, reinforcing expectations for further BoJ tightening, though a weak growth outlook suggests a cautious approach to future rate hikes.
China
Mainland Chinese stock markets edged lower in a holiday-shortened week, with the CSI 300 and Shanghai Composite Index declining on Monday before the Lunar New Year break, which closes mainland markets until February 5. In Hong Kong, the Hang Seng Index posted slight gains before shutting for the remainder of the week. Government data signaled a weak start to 2025, as the official manufacturing PMI unexpectedly fell to 49.1 in January, while the nonmanufacturing PMI dropped to 50.2 from 52.2 in December. Though seasonal factors often soften manufacturing activity in January, other data pointed to broader economic struggles, with industrial profits falling 3.3% in 2024—the third consecutive annual decline—highlighting ongoing deflationary pressures and a prolonged real estate downturn that continues to weigh on domestic demand.
THIS WEEK’S HIGHLIGHTED STORY
https://www.visualcapitalist.com/ranked-how-key-commodities-have-performed-since-2019/
January 27, 2025
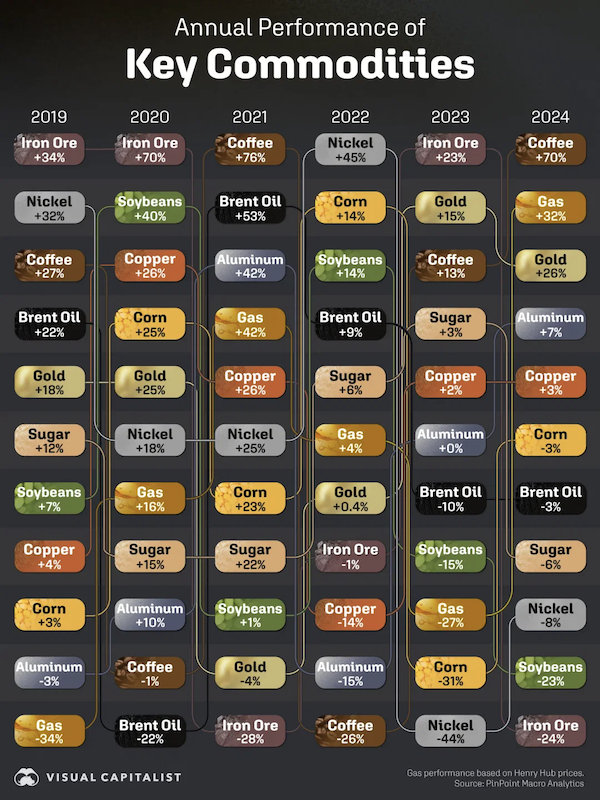
What We’re Showing:
Commodities have experienced significant volatility over the past several years, driven by the COVID-19 pandemic, supply chain disruptions, and geopolitical tensions.
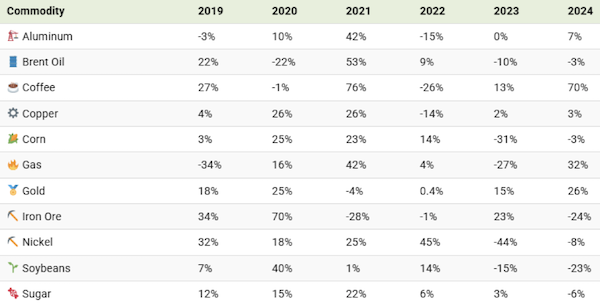
In this graphic, we rank 11 key commodities by their annual performance since 2019.
Research provided by Sherman & Co., LLC.
Key Takeaways:
Coffee:
Like many other agricultural commodities, coffee bean prices have seen huge swings in recent years. This volatility is usually due to climate challenges in leading export countries such as Brazil and Vietnam. Ranking in second is the real estate sector, with corporate cash making up 46% of current assets. This is due to the fact that companies in the sector largely invest in non-current assets, including properties and land, which leads its cash as a share of current assets to be higher than the majority of sectors.
Brazil, which grows arabica beans, suffered a severe drought in 2024 which amplified fires, interrupted hydro power, and parched crops. During the same year, Vietnam’s coffee trees were negatively impacted by heat waves which shrink the size of coffee cherries (the fruit that contains the coffee bean). Vietnam is the world’s top supplier of robusta beans, which is commonly used for instant coffee.
Gold:
Gold has been a top performing commodity over the past two years, after weaker performance in the post-COVID years of 2021 and 2022.
This is driven by several factors:
- High demand from central banks: Central banks (emphasis on China’s) have been building their gold reserves to diversify away from the U.S. dollar
- Geopolitical tensions: Global conflicts and trade wars are making safe-haven assets like gold more attractive
- Inflation concerns: Gold is also viewed as a hedge against inflation, further bolstering its demand
HOW VIX WORKS
The Volatility Index or VIX is the annualized implied volatility of a hypothetical S&P 500 stock option with 30 days to expiration. It can help investors estimate how much the S&P 500 Index will fluctuate in the next 30 days. While the VIX only measures the volatility of the S&P 500 Index, it has become a benchmark for the U.S. stock market.
The VIX is often referred to as the market’s “fear index or fear gauge”. The performance of the VIX is inversely related to the S&P 500 – when the price of the VIX goes up, the price of the S&P 500 usually goes down.
If the VIX is rising, demand for options is increasing, and therefore, becoming more expensive. If the VIX is falling, there's less demand, and options prices tend to fall. One thing to keep in mind is that current volatility cannot be known ahead of time. That's why it's a good idea to use the VIX in tandem with technical and fundamental analysis.
HOW CAPE WORKS
The cyclically adjusted price-to-earnings ratio (CAPE) can be used to smooth out the shorter-term earnings swings to get a longer-term assessment of market valuation. An extremely high CAPE ratio means that a company’s stock price is substantially higher than the company’s earnings would indicate and, therefore, overvalued. It is generally expected that the market will eventually correct the company’s stock price by pushing it down to its true value.
In the past, the CAPE ratio has proved its importance in identifying potential bubbles and market crashes. The historical average of the ratio for the S&P 500 Index is between 15-16, while the highest levels of the ratio have exceeded 30. The record-high levels occurred three times in the history of the U.S. financial markets. The first was in 1929 before the Wall Street crash that signaled the start of the Great Depression. The second was in the late 1990s before the Dotcom Crash, and the third came in 2007 before the 2007-2008 Financial Crisis.
https://www.multpl.com/shiller-pe
Sources:
All index and returns data from Norgate Data and Commodity Systems Incorporated and Wall Street Journal
News from Reuters, Barron’s, Wall St. Journal, Bloomberg.com, ft.com, guggenheimpartners.com, zerohedge.com, ritholtz.com, markit.com, financialpost.com, Eurostat, Statistics Canada, Yahoo! Finance, stocksandnews.com, marketwatch.com, visualcapitalist.com, wantchinatimes.com, BBC, 361capital.com, pensionpartners.com, cnbc.com, FactSet, Morningstar/Ibbotson Associates, Corporate Finance Institute.
Commentary from T Rowe Price Global markets weekly update — https://www.troweprice.com/personal-investing/resources/insights/global-...