September 2015: US Unemployment Rate Now Stands at 5.1%
Submitted by The Blakeley Group, Inc. on September 10th, 2015“Nothing is so painful to the human mind as a great and sudden change.”
The very big picture:
In the “decades” timeframe, the question of whether we are in a continuing Secular Bear Market that began in 2000 or in a new Secular Bull Market has been the subject of hot debate among economists and market watchers since 2013, when the Dow and S&P 500 exceeded their 2000 and 2007 highs. The Bear proponents point out that the long-term PE ratio (called “CAPE”, for Cyclically-Adjusted Price to Earnings ratio), which has done a historically great job of marking tops and bottoms of Secular Bulls and Secular Bears, did not get down to the single-digit range that has marked the end of Bear Markets for a hundred years, but the Bull proponents say that significantly higher new highs are de-facto evidence of a Secular Bull, regardless of the CAPE. Further confusing the question, the CAPE now has risen to levels that have marked the end of Bull Markets except for times of full-blown market manias. See Fig. 1 for the 100-year view of Secular Bulls and Bears.
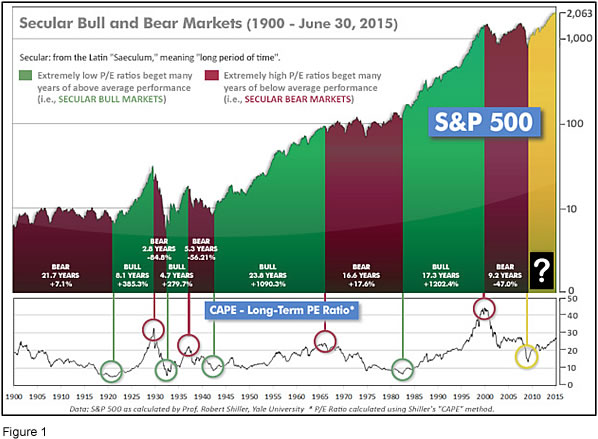
Even if we are in a new Secular Bull Market, market history says future returns are likely to be modest at best. The CAPE is at 24.4, down from the prior week’s 25.2, and approximately at the level reached at the pre-crash high in October, 2007. In fact, since 1881, the average annual returns for all ten year periods that began with a CAPE at this level have been just 3%/yr (see Fig. 2). (Note: all P/E references are to the Shiller P/E values, sometimes called PE10 or CAPE, which are calculated so as to remove shorter-term fluctuations; see robertshiller.com for details).
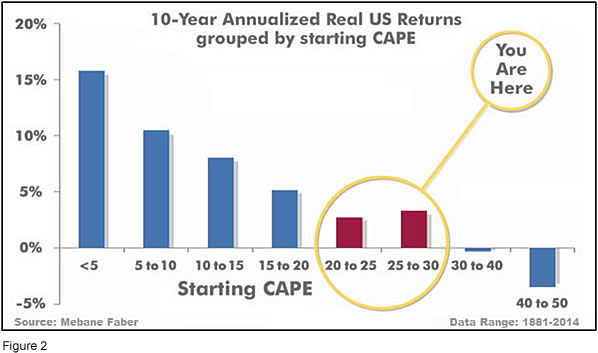
This further means that above-average returns will be much more likely to come from the active management of portfolios than from passive buy-and-hold. Although a mania could come along and cause the CAPE to shoot upward from current levels (such as happened in the late 1920’s and the late 1990’s), in the absence of such a mania, buy-and-hold investors will likely have a long wait until the arrival of returns more typical of a rip-snorting Secular Bull Market.
In the big picture:
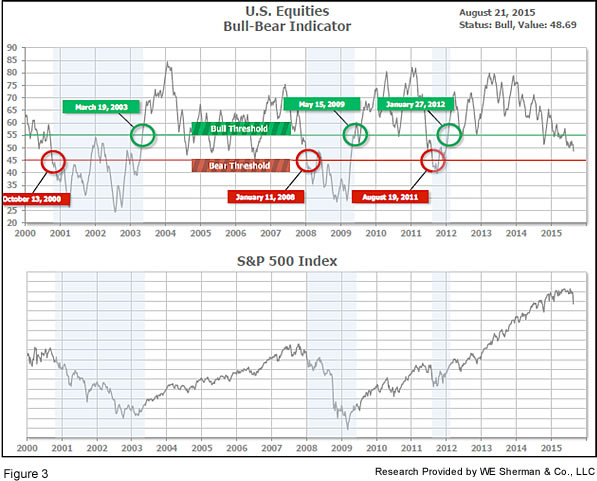
The “big picture” is the months-to-years timeframe – the timeframe in which Cyclical Bulls and Bears operate. The US Bull-Bear Indicator (see Fig. 3) is at 50.92, down from the prior week’s 54.77, and continues in Cyclical Bull territory. Several of the world’s major markets have entered Bear territory, most notably China and Brazil, while many of the world’s other markets – including the US – are in “correction” territory (10% or more from their highs).
In the intermediate picture:
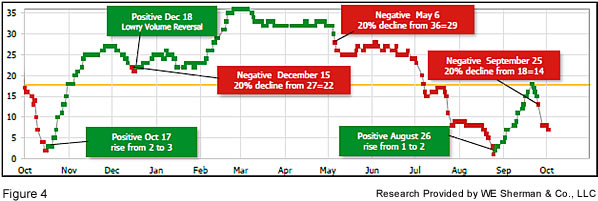
The intermediate (weeks to months) indicator (see Fig. 4) has been Positive since August 26, after having been Negative since May 6. The indicator ended the week at 7, up from the prior week’s 3. Separately, the quarter-by-quarter indicator – based on domestic and international stock trend status at the start of each quarter – gave a positive indication on the first day of July for the prospects for the fourth quarter of 2015.
Timeframe summary:
In the Secular (years to decades) timeframe (Figs. 1 & 2), whether we are in a new Secular Bull or still in the Secular Bear, the long-term valuation of the market is simply too high to sustain rip-roaring multi-year returns. In the Cyclical (months to years) timeframe (Fig. 3), all major equity markets are in Cyclical Bull territory. In the Intermediate (weeks to months) timeframe (Fig. 4), US equity markets are again rated as Positive. The quarter-by-quarter indicator gave a positive signal for the 3rd quarter: US equities were in an uptrend at the start of Q3 2015, sufficient to signal a higher likelihood of an up quarter than a down quarter.
In the markets:
Stocks gave up last week’s gains and reversed course again to end the week in negative territory for both the week and year-to-date. Volatility remained high with sharp drops on Tuesday and Friday more than offsetting earlier gains. The Dow lost over 540 points to end the week at 16,102. The Nasdaq declined over 144 points, closing at 4683. The SmallCap Russell 2000 showed relative strength, down only -2.3%. The SmallCaps are thought to have fared better due to their lower level of exposure to the travails in China, compared with LargeCap companies (-3.4% for the week) most of which have overseas operations. Canada’s TSX did a bit better than the US at -2.8%.
European market results looked quite similar to the US for the week: the United Kingdom’s FTSE dropped -3.28%, Germany’s DAX ended down -2.53%, France’s CAC40 declined -3.25%, and Italy’s FTSE Milan index also lost over ‑2.3%. In Asia, China’s Shanghai composite had its 3rd consecutive week of declines, down -2.23%. Japan’s Nikkei, which had been holding tenaciously to the 20,000 level until the week before last, fell sharply to end the week at 17,792 – a loss of more than -7%!
In commodities, crude oil had its second straight week of gains up +1.02% to close at $45.77 a barrel. Gold lost ‑$10.30 an ounce, closing the week at $1122.30. Copper gave up last week’s gain, dropping -1.24%.
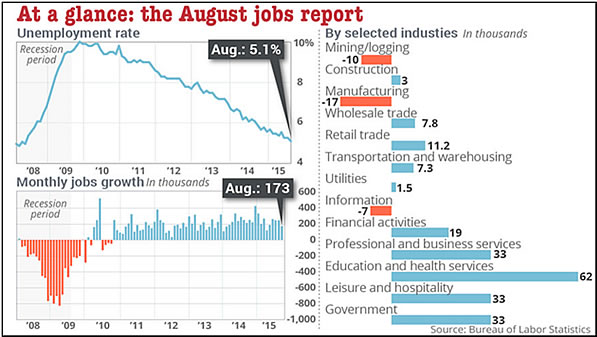
In US economic news, the very important NonFarm Payroll report (NFP) was released on Friday, showing that US employers added 173,000 jobs in August, missing expectations of a 223,000 gain. The jobless rate fell to 5.1%, the lowest level since April 2008. The latest rate meets the Federal Reserve’s definition of “Full Employment”, even though the labor force participation rate remained unchanged at a historically low 62.6%. Analysts speculate that the latest jobless numbers may give the Fed the confidence it needs to finally begin raising interest rates.
The Mortgage Bankers Association (MBA) reported that refinancing applications jumped +17% last week. Mortgage rates remained unchanged, though treasury yields declined slightly. Applications to purchase a home rose +4%. The MBA’s composite index rose +11.3% for the week. CoreLogic reported that home prices rose +1.7% in July, a 6.9% yearly increase. CoreLogic is forecasting a +4.7% yearly gain thru next July.
The US services sector remains strong as the Institute for Supply Management’s (ISM) nonmanufacturing index stayed at 59 in August. It was the second strongest month since December 2005, and beat analyst forecasts. New orders came in at an even stronger 63.4. Factory growth in the Midwest remained stable according to the regional ISM Chicago/Midwest manufacturing index. The gauge edged down -0.3 point to 54.4 vs. forecasts for no change, but still in expansion (>50) territory. Nationally, however, the US Purchasing Managers Index (PMI) for manufacturing hit a two year low, falling 1.6 points to 51.1 in August. This is the lowest since May 2013. New orders dropped -4.8 points to 51.7, while export orders fell further into contraction.
Oil’s plunge is hitting the Lone Star State particularly hard. The Dallas Federal Reserve reported regional energy production and manufacturing fell sharply, as did a measure of new orders. Oil prices have continued the retreat since late June, reaching a fresh 6-year low below $38 a barrel last week before rebounding back into the low $40’s this week.
Canada’s economy contracted for a second straight quarter, putting the country technically in recession (the technical definition is two consecutive quarters of GDP shrinkage). GDP declined at a -0.5% annualized pace in the second quarter, according to Statistics Canada. The agency revised the first quarter contraction to -0.8% from ‑0.6%. Business investment fell by -7.9% in the second quarter after a -10.9% decline in the first three months of the year. The decline in business investment and the continued weakness in crude oil prices were cited as the chief causes of the contracting GDP. Employment in Canada was a mixed picture in August. Payrolls expanded by +12,000 beating expectations of a decline of -2500, but despite the gain the jobless rate ticked up to 7% from 6.8%.
In the Eurozone, August consumer prices rose just +0.2% vs. a year earlier, while core prices climbed +1%, the EU’s statistics office said. Both were unchanged from July. The European Central Bank (ECB) has an inflation target of just under 2%, but has struggled to make headway toward that goal given sluggish Eurozone and global activity while renewed falls in oil prices and strength in the Euro continue to put downward pressure on prices and inflation. The European Central Bank therefore cut its forecast on inflation to just 0.1% this year, from 0.3%. It also reduced next year’s forecast to 1.1% in 2016 from 1.5%. GDP was also revised down to 1.4%. ECB president Mario Draghi said the ECB’s bond buying program would be expanded if necessary.
Manufacturing in the Eurozone declined slightly from 52.4 to 52.3, according to Markit’s August PMI. The report noted that employment was rising at the fastest pace in four years. Although France and Greece remained in contraction, other large Eurozone economies including Spain and Italy had strong readings. The composite PMI ticked up to 54.3 in the final August reading, up +0.4 point from July. The service component was 54.4, also a +0.4 increase over July.
Manufacturing in China fell further into contraction according to the private Caixin-Markit PMI, which came in at 47.3. This was the quickest deterioration in operating conditions since 2009. It was also the sixth straight month of contraction. Factory output sank the fastest since November 2011. The “official” China PMI, which focuses more on large state-owned companies, declined -0.3 point to 49.7, the lowest in three years.
Finally, as mentioned earlier in this report, the US unemployment rate now stands at 5.1% – the lowest since 2008. Market weakness on Friday is being attributed at least in part to the reality that with the unemployment rate now in the Federal Reserve’s target window of “full employment”, a rate hike could be in the cards as soon as mid-September. Even though at first blush the August NonFarm Payroll (NFP) report was on the weak side at just 173,000 jobs added, the August jobs report in particular has a longstanding reputation for being frequently revised upward due to problems with seasonal adjustments and widely off-the-mark estimates. Jim O’Sullivan, Chief U.S. Economist at High Frequency Economics stated that “payrolls were weaker than generally expected, but there has been a clear tendency for the August data to be underreported initially and then revised up later.” Here is a multi-part graphic from marketwatch.com that nicely summarizes all the major parts of the August report:
(sources: Reuters, Barron’s, Wall St Journal, Bloomberg.com, ft.com, guggenheimpartners.com, ritholtz.com, markit.com, financialpost.com, Eurostat, Statistics Canada, Yahoo! Finance, stocksandnews.com, marketwatch.com, wantchinatimes.com, BBC, 361capital.com, pensionpartners.com, cnbc.com; Figs 3-5 source W E Sherman & Co, LLC)
The ranking relationship (shown in Fig. 5) between the defensive SHUT sectors (“S”=Staples [a.k.a. consumer non-cyclical], “H”=Healthcare, “U”=Utilities and “T”=Telecom) and the offensive DIME sectors (“D”=Discretionary [a.k.a. Consumer Cyclical], “I”=Industrial, “M”=Materials, “E”=Energy), is one way to gauge institutional investor sentiment in the market.
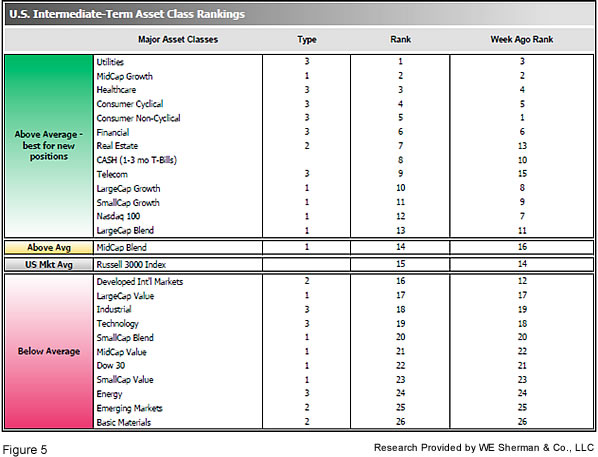
The average ranking of Defensive SHUT sectors fell to 6.8 from the prior week’s 5.5, while the average ranking of Offensive DIME sectors rose slightly to 17.8 from the prior week’s 17.3. The Defensive SHUT sectors have still maintained a sizable lead in rankings over the Offensive DIME sectors. Note: these are “ranks”, not “scores”, so smaller numbers are higher ranks and larger numbers are lower ranks.
Summary:
The US has led the worldwide recovery, and continues to be among the strongest of global markets. However, the over-arching Secular Bear Market may remain in place globally even as new highs are reached in the US.
Because the world may still be in a Secular Bear, we have no expectations of runs of multiple double-digit consecutive years, and we expect poor market conditions to be a frequent occurrence. Nonetheless, we remain completely open to any eventuality that the market brings, and our strategies, tactics and tools will help us to successfully navigate whatever happens.

