SEPT 2021 JOBS
Submitted by The Blakeley Group, Inc. on September 10th, 2021The very big picture (a historical perspective):
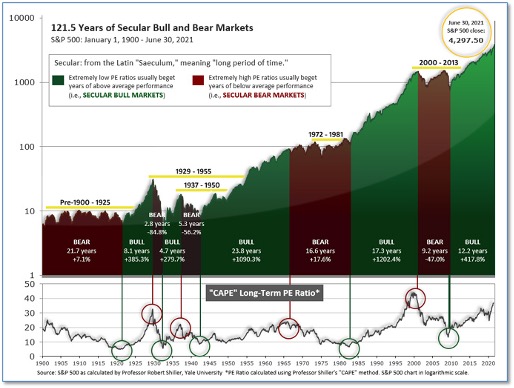
The long-term valuation of the market is commonly measured by the Cyclically Adjusted Price to Earnings ratio, or “CAPE”, which smooths-out shorter-term earnings swings in order to get a longer-term assessment of market valuation. A CAPE level of 30 is considered to be the upper end of the normal range, and the level at which further PE-ratio expansion comes to a halt (meaning that further increases in market prices only occur as a general response to earnings increases, instead of rising “just because”). The market was recently at that level.
Of course, a “mania” could come along and drive prices higher - much higher, even - and for some years to come. Manias occur when valuation no longer seems to matter, and caution is thrown completely to the wind - as buyers rush in to buy first, and ask questions later. Two manias in the last century - the “Roaring Twenties” of the 1920s, and the “Tech Bubble” of the late 1990s - show that the sky is the limit when common sense is overcome by a blind desire to buy. But, of course, the piper must be paid, and the following decade or two were spent in Secular Bear Markets, giving most or all of the mania-gains back.
The Very Big Picture: 120 Years of Secular Bulls and Bears

Figure 1
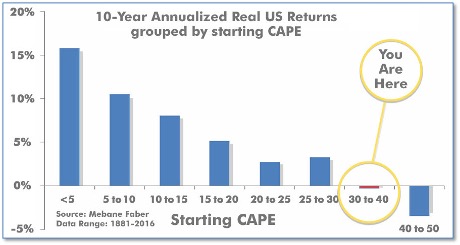
See Fig. 1 for the 100-year view of Secular Bulls and Bears. The CAPE is now at 39.17, unchanged from the prior week. Since 1881, the average annual return for all ten-year periods that began with a CAPE in the 30-40 range has been slightly negative (see Fig. 2).
The Very Big Picture: Historical CAPE Values
Current reading: 39.17

Figure 2
Note: We do not use CAPE as an official input into our methods. However, if history is any guide - and history is typically ‘some’ kind of guide - it’s always good to simply know where we are on the historic continuum, where that may lead, and what sort of expectations one may wish to hold in order to craft an investment strategy that works in any market ‘season’ … whether current one, or one that may be ‘coming soon’!
The big picture:
As a reading of our Bull-Bear Indicator for U.S. Equities (comparative measurements over a rolling one-year timeframe), we remain in Cyclical Bull territory.
The complete picture:
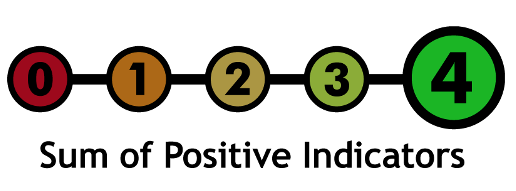
Counting-up of the number of all our indicators that are ‘Up’ for U.S. Equities (see Fig. 3), the current tally is that four of four are Positive, representing a multitude of timeframes (two that can be solely days/weeks, or months+ at a time; another, a quarter at a time; and lastly, the {typically} years-long reading, that being the Cyclical Bull or Bear status).

In the markets:
U.S. Markets: The major U.S. indexes ended the week mixed after the S&P MidCap 400 index joined the large cap S&P 500 and NASDAQ Composite indexes in reaching new intraday highs this week. The real estate sector outperformed within the S&P 500 while financials lagged. The Dow Jones Industrial Average shed 87 points finishing the week at 35,369, a decline of -0.2%. The technology-heavy NASDAQ Composite finished the week up 1.5%. By market cap, the S&P 500 added 0.6%, the S&P 400 retreated -0.2%, and the small cap Russell 2000 finished up 0.7%.
International Markets: International markets finished the week predominantly to the upside. Canada’s TSX gained 0.9% while the United Kingdom’s FTSE 100 ticked down -0.1%. On Europe’s mainland, France’s CAC 40 rose 0.1%, while Germany’s DAX declined -0.4%. In Asia, China’s Shanghai Composite rose 1.7%, and Japan’s Nikkei surged 5.4%. As grouped by Morgan Stanley Capital International, emerging markets rose 3.0% while developed markets gained 1.7%.
Commodities: Precious metals rose last week. Gold gained 0.8% to $1833.70 per ounce, while Silver rallied 3.1% to $24.80 per ounce. Oil was also bid higher for a second week, rising 0.8% to $69.29 per barrel of West Texas Intermediate crude. The industrial metal copper, viewed by some analysts as a barometer of world economic health due to its wide variety of uses, ticked up a slight 0.05%.
August Summary: August was a good month for the U.S. stock market. The Dow added 1.2% and the NASDAQ surged 4.0%. Large caps gained 2.9%, mid caps rose 1.8%, and small caps added 2.1%. International markets also had a strong month in August. Canada and the UK gained 1.5% and 1.2%, respectively, while France rose 1% and Germany added 1.9%. Japan finished the month up 3% and China 4.3%. Developed markets gained 1.4%. Emerging markets rose 1.6%. August was generally not kind to commodities. In August, Gold added 0.05%, while Silver declined -6.0%. Oil ended the month down -7.4% and Copper retreated -2.4%.
U.S. Economic News: Jobless claims fell to a new pandemic low of last week, despite an uptick in coronavirus cases. The Labor Department reported initial jobless claims fell by 14,000 to 340,000 in the week ended August 28th. Economists had expected new claims would total 345,000. Prior to the pandemic, initial jobless claims had been averaging in the low 200,000’s. By most measures the labor market is quite strong. Job openings recently topped 10 million for the first time and many companies are offering higher pay to attract workers. Millions of people who had a job before the pandemic still haven’t chosen to return to work. Meanwhile, the number of people already collecting state jobless benefits, so-called ‘continuing claims’ slid by 160,000 to 2.75 million. This reading is also at a pandemic era low. Altogether, some 12.2 million people were reportedly receiving benefits through eight separate state or federal programs as of Aug. 14.
The U.S. added just 235,000 new jobs in August as employers continue having difficulty finding qualified workers. The increase in new jobs was the smallest in seven months and fell well short of Wall Street’s forecast. Economists had expected 720,000 new jobs would be added. The details of the August employment report were lackluster across the board. Analysts say the rapid spread of the new ‘delta variant’ of the coronavirus may have driven a lot of companies to freeze hiring plans, while others say it’s a lack of available workers. Meanwhile, the unemployment rate dropped 0.2% to 5.2%--a new pandemic low. However, the official rate underestimates the true unemployment level as it only measures people that report actively looking for employment. The broader U-6 measure, which includes people that are eligible to work but no longer looking, stands at 8.9%.
The number of “pending” home sales, in which a contract has been signed but not yet closed, slid for a second month in a row despite economists’ predictions of an increase. The National Association of Realtors (NAR) reported pending home sales fell 1.8% in July from the previous month. Economists had projected a 0.5% increase. Compared to last year, there was an even more significant decline in pending home sales, with an 8.5% drop. On a regional basis, only the West saw an improvement in contract signings, with a 1.9% monthly increase. The Northeast experienced the largest monthly decline of any region, with a 6.6% drop from June. Every region saw pending home sales decrease on an annual basis.
Home prices continued rising at a record pace in June, according to a leading barometer. The latest reading of the S&P CoreLogic Case-Shiller Home Price index showed home prices increased 18.6% from the same time last year—its third consecutive month of setting new record growth numbers in the more than 30-year history of the index. The separate 20-city index, which measures price appreciation in major metropolitan areas across the country, saw a 19.1% year-over-year gain. The largest price gains were recorded in Phoenix, San Diego and Seattle. In 19 of the 20 cities analyzed, home prices are at record highs, with Chicago being the lone holdout.
Coincidentally, a measure of business conditions in the Chicago area slipped in August, but not because of the coronavirus. Companies are still reporting they can’t get enough supplies or people willing to work to keep up with new orders. The Chicago Business Barometer, also known as the Chicago PMI, fell to 66.8 last month from 73.4 in July. Just a few months earlier, the index had touched an almost 50-year high. The decline in August was worse than expected. Economists had forecast the index to decline to 69.4.
The confidence of American consumers sank in August to a six-month low as prices on just above everything continued to rise and the delta strain of the coronavirus continued to spread. The Conference Board reported its index of consumer confidence slid 11.3 points to 113.8 in August. Furthermore, higher prices on gasoline, groceries, and just about everything else are taking a toll. Inflation is running at its highest level in 30 years according to the Federal Reserve’s preferred price barometer. In the details of the report, the gauge that measures how Americans view the next six months also fell. The so-called future expectations index slid to 91.4 from 103.8 to mark the lowest reading since January.
International Economic News: Canada’s economy unexpectedly contracted in the second quarter, falling short of market expectations. Canada's gross domestic product, or the broadest measure of goods and services produced in the economy, contracted at a 1.1% annualized rate in the second quarter to 2.071 trillion Canadian dollars, or the equivalent of $1.643 trillion, Statistics Canada said. Market expectations were for a 2.5% advance in the quarter, according to economists at TD Bank. Statistics Canada also provided an early estimate for July, which suggests GDP declined by 0.4% from the previous month. Analysts attribute economic restrictions due to a resurgence in COVID-19 infections in the spring for both misses.
Across the Atlantic, confidence among U.K. businesses hit a four-year high, but staffing shortages remain a concern. The vaccine rollout, removal of lockdown restrictions and changes to self-isolation rules all contributed to greater optimism among firms in August, according to the latest snapshot from Lloyds Bank. The rebound in sentiment in August was widespread across the UK, with nine of 12 regions reporting improving confidence, particularly in the north-west. Growth in confidence was sharpest in the services sector, as businesses including bars, restaurants and hotels have benefited from a return of customers. The bank’s business barometer showed overall confidence rose by six points to 36% in August, marking its highest level since April 2017 and offsetting a slight dip in July. Optimism over the state of the economy also rose for the first time in three months, up six points to 38%.
On Europe’s mainland, French Finance Minister Bruno Le Maire said he’s not in favor of a broad boost to wages as such a move would hurt French competitiveness in the global market. Speaking at the Ambrosetti forum, an annual international economic conference in Italy, Le Maire said that a year ago European economies were concerned about rising unemployment and companies collapsing amid the initial pandemic-induced lockdowns. “Today we’re facing a new concern, which is the consequence of the strong economic recovery: we are facing the lack of workers and the lack of raw materials,” Le Maire said. Earlier this week, data showed French inflation hit the highest level in almost three years, led by food and energy costs. French unions and student organizations have called recently for higher salaries and a halt to the closing of some public services.
Germany, which is no stranger to what can happen when inflation gets out of control, posted a fresh 13-year high in consumer price inflation for August. Preliminary figures from the Federal Statistics Office showed consumer prices on an annualized basis rose 3.4% in August, up 0.3% from July. The August reading matched expectations and marked the highest level since July 2008. Commerzbank analyst Ralph Solveen said, “This is due to higher energy and food prices, while the core inflation probably even fell slightly form 2.9% to 2.8%.” As in other developed countries, analysts don’t expect inflation to ebb anytime soon. LBBW economist Elmar Voelker said the inflation rate would rise further in the coming months.
In Asia, China’s economy stalled in August as the country faced a resurgence in coronavirus cases and contended with the ongoing shipping crisis. An official survey of manufacturing activity fell to 50.1 in August from 50.4 in July, just above the 50-point mark indicating expansion vs. contraction. A private survey of factory activity also showed signs of trouble. The private Caixin manufacturing Purchasing Managers’ Index fell to 49.2 in August—its first contraction since April of 2020. Service industries, which now account for a larger slice of the world's second biggest economy, fared even worse, according to the official survey. The non-manufacturing Purchasing Managers' Index plunged to 47.5 from 53.3 in July.
Bank of Japan policymaker Goushi Kataoka said this week the coronavirus pandemic may weigh on the nation’s economy longer than initially expected. Katoaka warned of heightened risks to the central bank’s forecast of a moderate recovery. "Given recent domestic and global economic developments, the need for bolder steps is heightening," Kataoka said. An advocate of aggressive monetary easing, Kataoka has been a consistent, sole dissenter to the BOJ's decision to keep its interest rate targets unchanged. "Personally, I believe the BOJ must strengthen monetary easing" as inflation will remain distant from the bank's 2% target for years even if the economy were to recover, he said.
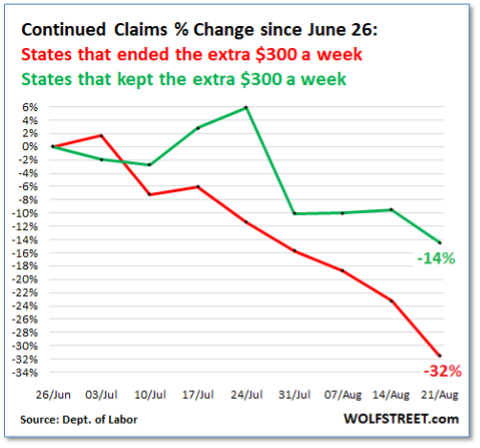
Finally: With this month’s big miss in the jobs number, the debate continues on whether the scarcity of American workers is due to fears of the coronavirus keeping people at home or perhaps due to the effect of generous government handouts. One way to measure the effect of the latter is to compare the continuing claims of the already-unemployed in the states which have kept the extra $300/week unemployment benefit payments vs the continuing claims of the already-unemployed in the states that terminated the extra benefit payments at the end of June. By this measure, the answer is clear: the already-unemployed returned to work at a substantially higher rate in states which dropped the extra $300/week payments – exactly the intended effect. (Chart from WolfStreet.com)

(Sources: All index- and returns-data from Yahoo Finance; news from Reuters, Barron’s, Wall St. Journal, Bloomberg.com, ft.com, guggenheimpartners.com, zerohedge.com, ritholtz.com, markit.com, financialpost.com, Eurostat, Statistics Canada, Yahoo! Finance, stocksandnews.com, marketwatch.com, wantchinatimes.com, BBC, 361capital.com, pensionpartners.com, cnbc.com, FactSet.)

