OCT 2017: Strong Gains Across the Board for the US for Q3
Submitted by The Blakeley Group, Inc. on October 9th, 2017We have been a proponent of Value at Risk (VaR) for a number of years and we now have a vendor to help automate calculations. Let us know if you would like to see a briefing paper on VaR and the analysis of your portfolio.
~ Dick Blakeley, CEO/CIO
NOTE: Areas with blue text show the most recent market updates since the September Capital Highlights email.
In the "decades" timeframe, the current Secular Bull Market could turn out to be among the shorter Secular Bull markets on record. This is because of the long-term valuation of the market which, after only eight years, has reached the upper end of its normal range.
The long-term valuation of the market is commonly measured by the Cyclically Adjusted Price to Earnings ratio, or “CAPE”, which smooths out shorter-term earnings swings in order to get a longer-term assessment of market valuation. A CAPE level of 30 is considered to be the upper end of the normal range, and the level at which further PE-ratio expansion comes to a halt (meaning that increases in market prices only occur in a general response to earnings increases, instead of rising “just because”).
Of course, a “mania” could come along and drive prices higher – much higher, even – and for some years to come. Manias occur when valuation no longer seems to matter, and caution is thrown completely to the wind as buyers rush in to buy first and ask questions later. Two manias in the last century – the 1920’s “Roaring Twenties” and the 1990’s “Tech Bubble” – show that the sky is the limit when common sense is overcome by a blind desire to buy. But, of course, the piper must be paid and the following decade or two are spent in Secular Bear Markets, giving most or all of the mania gains back.
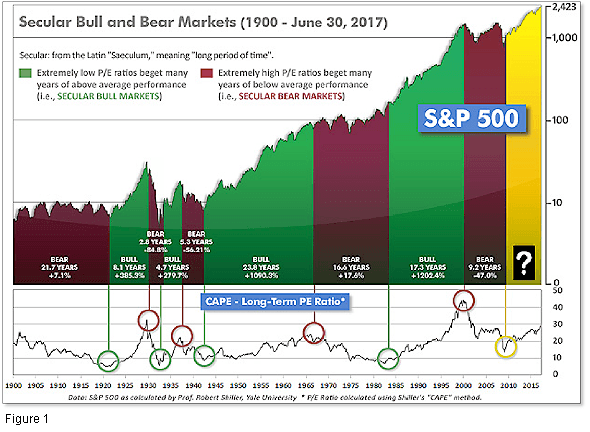
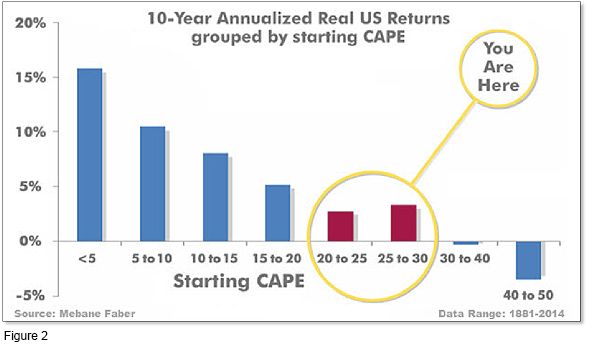
Even if we are in a new Secular Bull Market, market history says future returns are likely to be modest at best. The CAPE is at 30.83 up from last week’s 30.62, and now exceeds the level reached at the pre-crash high in October, 2007. Since 1881, the average annual return for all ten year periods that began with a CAPE around this level have been just 3%/yr (see Fig. 2).
In the big picture:
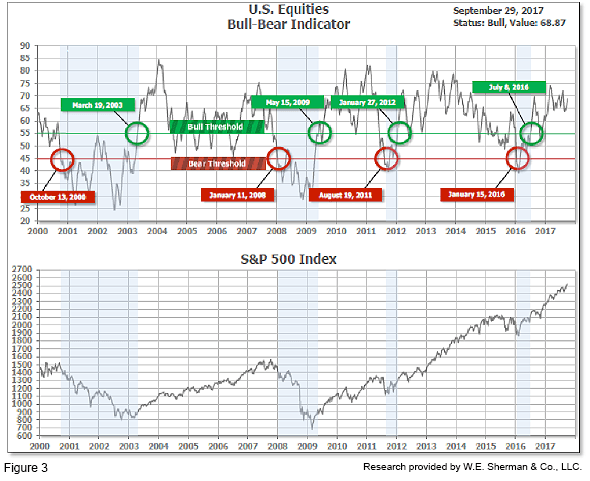
The “big picture” is the months-to-years timeframe – the timeframe in which Cyclical Bulls and Bears operate. The U.S. Bull-Bear Indicator (see Fig. 3) is in Cyclical Bull territory at 68.87, up from the prior week’s 67.03.
In the intermediate and Shorter-term picture:
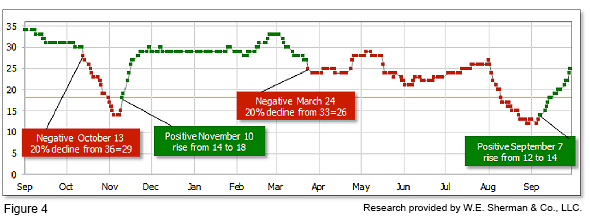
The Shorter-term (weeks to months) Indicator (see Fig. 4) turned positive on September 7th. The indicator ended the week at 25, up sharply from the prior week’s 20. Separately, the Intermediate-term Quarterly Trend Indicator - based on domestic and international stock trend status at the start of each quarter – was positive entering October, indicating positive prospects for equities in the fourth quarter of 2017.
In the markets:
U.S. Markets: U.S. market indexes closed higher for the week, with many hitting new highs in the process. The Dow Jones Industrial Average had a second week of gains, rising 0.25% to close at 22,405. The technology-heavy Nasdaq Composite retraced all of last week’s decline by rising 1.07% to close at 6,495. By market cap, smaller caps continued to close their year-to-date performance gap with the small cap Russell 2000 surging 2.76% and the mid cap S&P 400 rising 1.54%, while the large cap S&P 500 gained 0.68%.
International Markets: Canada’s TSX had a third week of strong gains, rising 1.17%. In Europe, major markets were also green across the board. The United Kingdom’s FTSE rose 0.85%, France’s CAC 40 gained 0.92%, and Germany’s DAX led the parade with a gain of 1.88%. Italy’s Milan FTSE continued its recovery with a gain of 0.73%. In Asia, major markets were mixed. China’s Shanghai Composite declined a slight -0.11%, while Japan’s Nikkei rose 0.29%. Hong Kong’s Hang Seng fell over -1.1%. As grouped by Morgan Stanley Capital International, developed markets rose 0.13%, while emerging markets fell -1.26%.
Commodities: Precious metals retreated for a third straight week with Gold falling -0.98% to $1,284.80, while Silver retreated -1.8% to $16.68. In energy, a barrel of West Texas Intermediate crude oil rose by almost 2% to $51.67 a barrel. Copper, seen by some analysts as a proxy for global economic health due to its varied uses, ended the week up 0.36%. September Summary: Despite being statistically the worst month of the stock market year, the Dow Jones Industrial Average rose 2%, followed by the Nasdaq Composite which added 1%. The S&P 500 added 1.9%, the S&P 400 rose 3.76%, and the Russell 2000 surged a mighty 6.1%. International results were less unanimous. Canada’s TSX gained 2.78%, the United Kingdom’s FTSE fell -0.78%, and France’s CAC 40 and Germany’s DAX gained 4.8% and 6.4%, respectively. In Asia, China’s Shanghai Composite retreated -0.35%, while Japan’s Nikkei gained 3.6%. Overall, developed markets gained 2.4%, while emerging markets ended the quarter flat.
Third Quarter Summary: Strong gains across the board for the US for Q3. The Dow Jones Industrial Average gained 4.9%, while the Nasdaq Composite gained 5.79%. The S&P 500 added 3.96%, the S&P 400 rose 2.8%, and the Russell 2000 tacked on 5.3%. Gains were nearly universal in international markets for the quarter, as well. Canada’s TSX rose 2.98%, the United Kingdom’s FTSE was up a very modest 0.82%, and France’s CAC 40 rose 4.1%. Germany’s DAX, likewise, added 4.1%, while Italy’s Milan FTSE surged a strong 10.26%. In Asia, China’s Shanghai Composite rose 4.9%, while Japan’s Nikkei added 1.6%. For the quarter, developed markets rose 5% while emerging markets jumped 8.3%.
U.S. Economic News: The number of initial applications for new unemployment benefits rose by 12,000 to 272,000 last week, according to the Labor Department. Economists had only expected a total of 270,000. The less-volatile four-week moving average of claims rose by 9,000 to 277,750—its highest level in more than a year and a half. Still, new claims continue to remain under the key 300,000 threshold that analysts use to delineate a healthy jobs market. Continuing claims, the number of people already receiving benefits, fell by 45,000 to 1.93 million. That number is reported with a one-week delay.
Sales of new homes fell to an 8-month low last month even as demand remained strong. The Commerce Department reported that sales of new homes ran at a seasonally –adjusted annual rate of just 560,000 last month. That was 3.4% lower compared to last month, and 1.2% lower than the same time last year. New single-family home sales are down to their lowest annual sales rate since December. Economists had expected a 585,000 annual rate. The median sales price of a new home sold in August was $300,200, 0.4% higher than a year ago. The slower selling pace has allowed home inventory to return to more normal levels. At the current sales rate, there is a 6.1 month supply of homes for sale on the market. Home builders continue to struggle with three big challenges: a shortage of skilled labor, pricier land, and more expensive building materials.
Home prices overall continued to accelerate in July, led by the traditional hot markets - and one newcomer. The S&P/Case-Shiller 20-city index rose a seasonally-adjusted 5.8% in the three month period ending in July compared to the same time last year, and was up 5.6% from the previous month. For the month, both the 20-city and national indexes rose an unadjusted 0.7%. Seattle continued to lead the way, with prices rising 13.5% compared to the year-ago period, while home prices in Portland rose 7.6%. Las Vegas, which was one of the hottest housing markets during the housing bubble, enjoyed the third-strongest rate of price gains rising 7.4% compared to the same time last year. It was Las Vegas’ seventh-straight month of accelerating price gains. However, of note, Las Vegas home prices still remain about 30% lower than at their 2006 peak. Overall, the 20-City index is just 2.2% below its 2006 high.
The number of existing homes under contract fell last month, its fifth decline out of the last six months. The National Association of Realtors (NAR) reported that its pending home sales index fell 2.6% to 106.3. The index is now lower than any time since January 2016. Economists had only expected a 0.2% drop. The pending home sales index forecasts the number of future sales by tracking real estate transactions in which a contract has been signed but the deal has not yet closed. The group attributed the decline to the dwindling supply of homes available on the market. All regions reported declines. In the Northeast, pending home sales tumbled 4.4%. In the South pending sales fell 3.5%, and in the Midwest and West they retreated 1.5% and 1%, respectively. The NAR cut its full-year forecast for sales following the twin hurricanes of Irma and Harvey. The group now expects 5.44 million homes will be sold this year, down 0.2% from last year.
Confidence among consumers dipped slightly earlier this month, presumably due to the twin hits from hurricanes Harvey and Irma, but most Americans remained optimistic about the overall economy. According to the Conference Board, the consumer confidence index fell 0.6 point to 119.8. Economists had forecast a reading of 119.5. In Florida and Texas, two of the nation’s most populous states, confidence fell “considerably” following widespread damage from the two hurricanes. Lynn Franco, director of economic indicators at the board stated, “Despite the slight downtick in confidence, consumers’ assessment of current conditions remains quite favorable and their expectations for the short-term suggest the economy will continue expanding at its current pace.” Confidence soared after the election of Donald Trump and has remained high with the economy growing steadily and a healthy jobs market. Orders for long-lasting manufactured goods, so-called durable goods, jumped last month and business investment increased in another positive report on the U.S. economy. The Commerce Department reported durable goods orders climbed 1.7% last month, although it was predominantly due to a big order for commercial aircraft.
Orders for other manufactured goods rose as well, however at a weaker rate. Orders ex-transportation edged up 0.2%. Orders ex-defense and aircraft, used by analysts as a better measure of overall economic health, rose 0.9%. Core capital goods orders have risen in eight out of the last nine months.
Consumer spending was up just 0.1% last month, following a strong gain in July. Inflation continued to remain subdued. The Federal Reserve’s preferred measure of inflation, the Personal Consumption Expenditures index (PCE), increased by 0.1%. This matched the “core” consumer price index rate that strips out food and energy, which likewise edged up 0.1%. Weighing on consumer spending was a slowdown in August of vehicle purchases. Auto sales were down 1.8% last month. Over the last 12 months, the rate of PCE inflation remained unchanged at 1.4%, while the core rate fell to 1.3%. Both indexes remain well below the Federal Reserve’s 2% inflation target.
A measure of consumer sentiment retreated slightly this month, but Americans remained remarkably resilient after two hurricanes and some civil unrest. The University of Michigan’s consumer sentiment index fell 1.7 points to 95.1 this month. The survey director Richard Curtin noted that a slight decline was to be expected given the seemingly worsening political divide in the country, tensions with North Korea, racial issues in Charlottesville and St. Louis, and twin hurricane strikes. Given all that, confidence has remained “very favorable”, according to the release.
Overall U.S. economic output, or GDP, grew by 3.1% in the second quarter according to the latest reading from the Commerce Department. Growth was the quickest since the first quarter of 2015 and followed a 1.2% rate of growth in the first quarter. Economists had expected GDP would remain unrevised at 3.0%. Furthermore, economists point out, the rebuilding in Florida and Texas following the Hurricanes Harvey and Irma is expected to boost 4th quarter GDP growth. Third quarter GDP estimates are currently 2.2%. For the first half of the year, the economy grew by 2.1%. Consumer spending, which makes up more than two-thirds of the U.S. economy, remained unrevised at a growth rate of 3.3%, was the fastest in a year during the second quarter. International Economic News: Canada’s economy stalled in July, bringing its eight-month winning streak to an end and bringing growth back to more normal levels. Statistics Canada reported that Canadian real gross domestic product was flat in July, on a seasonally-adjusted basis, compared with June. It was the first time since October of 2016 that the economy failed to show month-over-month growth. After posting average month-over-month gains of 0.4% over the prior three months, economists had expected the economy to return to more normal levels of growth. Economists still expect a more reasonable but still healthy rate of growth in the second half of the year. Douglas Porter , chief economist at Bank of Montreal, wrote in a note, “The flat July GDP result represents a rare misstep for the Canadian economy in 2017. While we would never read too much into any one month, it could also mark a return to a more sustainable and realistic growth rate for the economy, after a year of staggeringly good news.”
Across the Atlantic, Britain has fallen from the top to the bottom of the group of seven largest economies in the year since the Brexit vote. Having been the fastest-growing economy in the G7 prior to the vote, new figures from the Office for National Statistics showed U.K. growth is now dead last, falling to -1.5% in the second quarter of 2017. Despite the poor economic reading, Bank of England governor Mark Carney hinted that interest rates were still likely to rise in November. Carney said, “If the economy continues on the track that it’s been on, and all indications are that it is, in the relatively near term we can expect that interest rates would increase somewhat.”
Across the Channel, the Bank of France raised its growth forecast for 2017 to 1.7%. Bank of France governor Francois Villeroy de Galhau made the forecast in an interview in newspaper Midi Libre. Villeroy de Galhau said “The economic recovery can’t be doubted…this year, it could reach 1.7%. But that would still put it below the average for the euro zone, which stands at over 2%. This underperformance highlights one imperative - we must take advantage of the recovery to step up reforms in France.” The updated forecast puts it in line with similar estimates from the Organization for Economic Cooperation and Development.
The German jobless rate fell to a new record low this month, but retail sales disappointed in a pair of conflicting reports on Europe’s largest economy. The unemployment rate dropped 0.1% to 5.6%, its lowest level since reunification in 1990, according to the Federal Labor Office. However, retail sales unexpectedly fell in August, declining 0.4%. The miss was almost a full percentage point down from the consensus forecast of a 0.5% rise. Over the last 12 months, retail sales were up 2.8% matching the previous month’s year-over-year increase but short of the 3.2% increase originally forecast.
China’s manufacturing sector expanded at its fastest pace in more than five years, according to the National Bureau of Statistics (NBS). The manufacturing Purchasing Managers’ Index (PMI) for September came in at 52.4, a 0.7 point increase from August. Readings above 50 indicate expansion. The reading has remained positive for 14 straight months and marked its highest level since May 2012. NBS statistician Zhao Qinghe stated the indicator has shown a stable upward trend and attributed the expansion to improving demand both at home and abroad and booming growth in high-tech industries.
In Japan, a collection of broadly positive economic reports released this week gave a boost to Prime Minister Shinzo Abe as he kicked off his re-election campaign. Factory output grew more than expected, along with household spending which edged up, while the unemployment rate remained at a more than two-decade low. Japan’s industrial production grew at 2.1% last month, capping six straight quarters of gains—its longest winning streak in over a decade. Household spending edged up 0.6% from the same time last year, slightly short of expectations for a 0.9% rise, but still positive. The spending data is particularly important as economists view household spending as the key to bringing Japan out of its deflationary environment. In addition, Japan’s unemployment rate came in at just 2.8%.
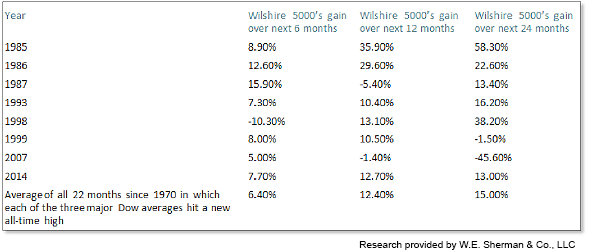
Finally: An unusual event occurred in the market during September. For the first time in more than three years, each of the three major Dow stock market averages all hit all-time highs during the month. The central tenet of the venerable “Dow Theory” is that a new high by one of the indexes, traditionally the Dow Industrials, is considered very bullish if confirmed by the Dow Transports, and even more bullish if the third (the Dow Utilities) joins in. The late Richard Russell, long-time proponent of the Dow Theory, called this a “Super Dow Theory” signal. This is a very rare development, happening in less than 4% of months since 1970. Encouragingly, never have any of these prior events occurred at a bull market top. And the worst performance of any prior occurrence (spring of 2007), still came five months before the eventual top. So, at the worst, the market appears poised for a continuation of market gains for at least a while. Market statistician Mark Hulbert compiled the statistics into the following table:
(sources: all index return data from Yahoo Finance; Reuters, Barron’s, Wall St Journal, Bloomberg.com, ft.com, guggenheimpartners.com, zerohedge.com, ritholtz.com, markit.com, financialpost.com, Eurostat, Statistics Canada, Yahoo! Finance, stocksandnews.com, marketwatch.com, wantchinatimes.com, BBC, 361capital.com, pensionpartners.com, cnbc.com, FactSet; Figs 1-5 source W E Sherman & Co, LLC)
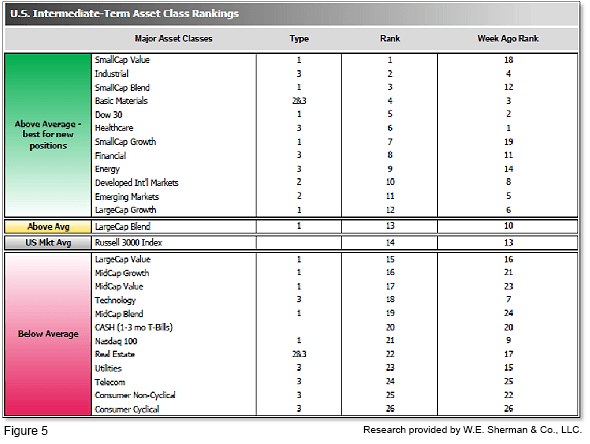
The ranking relationship (shown in Fig. 5) between the defensive SHUT sectors ("S"=Staples [a.k.a. consumer non-cyclical], "H"=Healthcare, "U"=Utilities and "T"=Telecom) and the offensive DIME sectors ("D"=Discretionary [a.k.a. Consumer Cyclical], "I"=Industrial, "M"=Materials, "E"=Energy), is one way to gauge institutional investor sentiment in the market. The average ranking of Defensive SHUT sectors fell sharply to 19.5 from the prior week’s 15.75, while the average ranking of Offensive DIME sectors rose to 10.25 from the prior week’s 11.75. The Offensive DIME sectors expanded their lead over the Defensive SHUT to the widest margin in more than 6 months. Note: these are “ranks”, not “scores”, so smaller numbers are higher ranks and larger numbers are lower ranks.

