October 2015: Consumer Confidence Improved
Submitted by The Blakeley Group, Inc. on October 9th, 2015October is the time to begin tax planning.
Call (408-459-4910) to schedule a time to see what steps you might take now to manage your tax burden on April 15th, 2016
NOTE: Areas with blue text show the most recent market updates since the September Capital Highlights email.
The very big picture:
In the “decades” timeframe, the question of whether we are in a continuing Secular Bear Market that began in 2000 or in a new Secular Bull Market has been the subject of hot debate among economists and market watchers since 2013, when the Dow and S&P 500 exceeded their 2000 and 2007 highs. The Bear proponents point out that the long-term PE ratio (called “CAPE”, for Cyclically-Adjusted Price to Earnings ratio), which has done a historically great job of marking tops and bottoms of Secular Bulls and Secular Bears, did not get down to the single-digit range that has marked the end of Bear Markets for a hundred years, but the Bull proponents say that significantly higher new highs are de-facto evidence of a Secular Bull, regardless of the CAPE. Further confusing the question, the CAPE now has risen to levels that have marked the end of Bull Markets except for times of full-blown market manias. See Fig. 1 for the 100-year view of Secular Bulls and Bears.
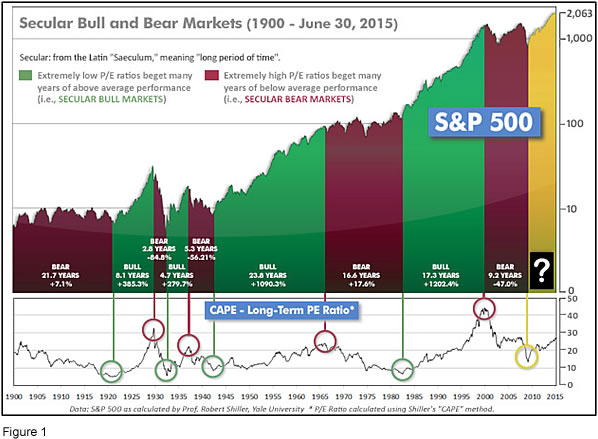
Even if we are in a new Secular Bull Market, market history says future returns are likely to be modest at best. The CAPE is at 24.8, up from the prior week’s 24.5, and approximately at the level reached at the pre-crash high in October, 2007. In fact, since 1881, the average annual returns for all ten year periods that began with a CAPE at this level have been just 3%/yr (see Fig. 2). (Note: all P/E references are to the Shiller P/E values, sometimes called PE10 or CAPE, which are calculated so as to remove shorter-term fluctuations; see robertshiller.com for details).
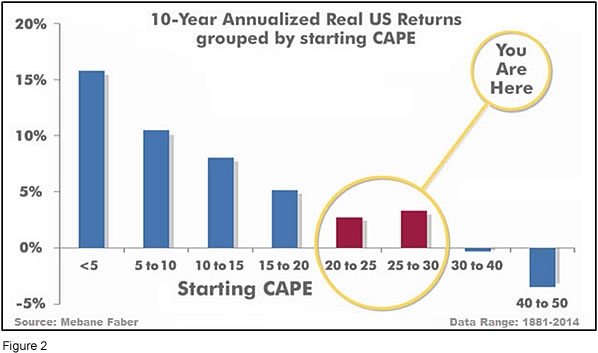
This further means that above-average returns will be much more likely to come from the active management of portfolios than from passive buy-and-hold. Although a mania could come along and cause the CAPE to shoot upward from current levels (such as happened in the late 1920’s and the late 1990’s), in the absence of such a mania, buy-and-hold investors will likely have a long wait until the arrival of returns more typical of a rip-snorting Secular Bull Market.
In the big picture:
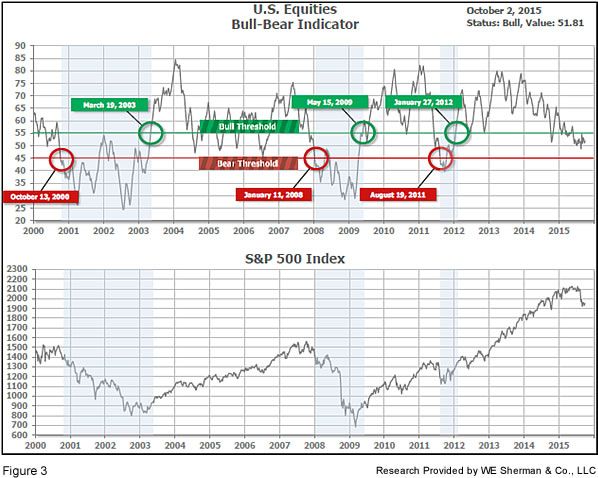
The “big picture” is the months-to-years timeframe – the timeframe in which Cyclical Bulls and Bears operate. The US Bull-Bear Indicator (see Fig. 3) is at 51.81, up a little from the prior week’s 51.12, and continues in Cyclical Bull territory. Several of the world’s major markets have entered Bear territory, most notably China and Brazil, while many of the world’s other markets – including the US – are in “correction” territory (10% or more from their highs).
In the intermediate picture:
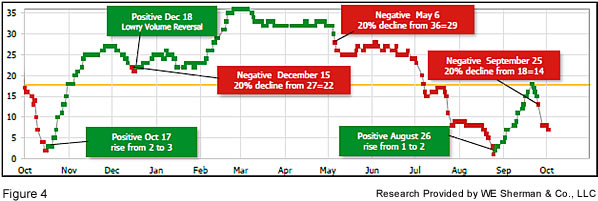
The intermediate (weeks to months) indicator (see Fig. 4) turned Negative on September 25, after being Positive since August 26. The indicator ended the week at 7, down from the prior week’s 13. Separately, the quarter-by-quarter indicator – based on domestic and international stock trend status at the start of each quarter – gave a negative indication on the first day of October for the prospects for the fourth quarter of 2015.
Timeframe summary:
In the Secular (years to decades) timeframe (Figs. 1 & 2), whether we are in a new Secular Bull or still in the Secular Bear, the long-term valuation of the market is simply too high to sustain rip-roaring multi-year returns. In the Cyclical (months to years) timeframe (Fig. 3), all major equity markets are in Cyclical Bull territory. In the Intermediate (weeks to months) timeframe (Fig. 4), US equity markets are rated as Negative. The quarter-by-quarter indicator gave a negative signal for the 4th quarter: neither US equities nor ex-US equities were in an uptrend at the start of Q4 2015, sufficient to signal a higher likelihood of a down quarter than an up quarter.
In the markets:
The major market indexes were mixed as worries over China’s economic slowdown and potential new rules in drug pricing gave way to a strong Friday afternoon rally that allowed many indexes to regain positive territory for the week. The Dow Jones Industrial Average gained 157 points for the week to close at 16472, a +0.97% advance. Large caps fared the best as the LargeCap S&P 500 gained +1.04%. The MidCap S&P 400 declined -0.15%, and the SmallCap Russell 2000 declined -0.77%. Recent sector losers – particularly Biotech, Energy and Basic Materials – all rallied hard into the end of the week. Whether these turnabouts are dead-cat bounces or genuine bottoms will not be known for a while.
In international markets, Canada’s TSX declined -0.29%. In Europe, France’s CAC 40 lost -0.49%, Germany’s DAX gave up -1.4%, while the United Kingdom’s FTSE gained +0.34%. In South America, Brazil’s Bovespa Stock index rallied +4.9%, after being deeply oversold and deep in “Bear” territory.
In commodities, silver added +0.93% to end the week at $15.23 an ounce. Gold diverged from silver and lost ‑$7.90 for the week, closing at $1137.60 an ounce despite a gain of $24.90 on Friday. A barrel of West Texas Intermediate crude oil gained +0.71% to $45.66 a barrel.
For the month of September, losses were booked in every market segment, but LargeCaps did better by far than SmallCaps. While the LargeCap Dow only lost -1.47% in October, the SmallCap Russell 2000 dropped -5.07%, cementing its position as the US market laggard at the ¾ marker of the year 2015. International investors were not spared any pain, either, as Developed International retreated -4.42% and Emerging International slipped ‑3.13% (with Brazil leading the Emerging category to the downside, plunging -11. 78%). Gold and Oil were also down for the month, but by lesser amounts than many recent months, at -1.80% and ‑7.61%, respectively.
The 3rd Quarter looked like a larger version of September, with losses across the board. Like September, the LargeCap Dow and S&P indexes lost the least, at -7.58% and -6.94% respectively, while the SmallCap Russell 2000 lost the most, at -12.22%. Canada’s TSX was in between, at -8.56%. Developed International lost -9.72%, but that looks good compared to Emerging International, which sank -17.26% during the Quarter. Brazil, the worst of the category in September, was also the worst of the Emerging group for the 3rd Quarter, losing a whopping ‑33.02%.
In US economic news, Friday’s Non-Farm Payrolls (NFP) report was the biggest single economic piece of news of the week. Nonfarm payroll jobs added in September were 142,000, nowhere near the 203,000 consensus estimate. The Labor Department reported that the official unemployment rate remained unchanged at 5.1%. The labor participation rate fell to just 62.4% — a 38-year low. Global economic weakness and a stronger dollar were cited as reasons for the decidedly poor numbers. The report was perceived as reducing the chance the Federal Reserve will raise interest rates this month. Last month, the Fed held off on raising rates citing global economic concerns, and those concerns were not allayed by any news since then – and most certainly not by the NFP report. Nonetheless, New York Federal Reserve President William Dudley stated that the Federal Reserve will likely raise rates this year, as the effects of cheaper oil and a stronger dollar play out. He reiterated that the Fed remains data-dependent, and that the hike could even come at this month’s meeting.
US factory orders fell -1.7%, worse than the consensus estimate of a -1.3% decline. Durable goods orders fell ‑2.3%. Ex-transportation, orders fell -0.8% in August. Consumers spent more than expected as incomes strengthened and inflation remained tame. On Monday, the Commerce Department reported that personal incomes rose +0.3% in August, just slightly below the +0.4% gain expected. Spending was stronger than expected with a +0.4% gain in August. Core inflation rose +0.1% in August, which is 1.3% higher versus a year ago.
Mortgage applications fell -6.7% last week, according to the Mortgage Bankers Association. Applications to purchase were down -6% and applications to refinance fell -8%. Home sales declined as contract signings fell ‑1.4% in the National Association of Realtors Pending Home Sales Index. This vastly missed expectations, which had been for a +0.5% gain. The West was the only region to see a gain in August home sales. The Federal Reserve is hoping a rebound in housing will offset the current decline in manufacturing activity in the United States. Home prices in the S&P/Case-Shiller index declined -0.2% in July. The 20 city index rose +5% for the year, slightly missing expectations. Dallas, Denver, and San Francisco continue to see the strongest price gains. Overall, prices remain about 12% below 2006 peaks, even while higher prices have been constraining more robust growth in the market.
Consumer confidence improved as the Conference Board’s sentiment gauge jumped to 103 from 101.3. Expectations had been for a continued decline to 96. The “present situation” component of consumer confidence increased to 121.1 from 115.8, but the “future expectations” component declined a half point to 91.
The Institute for Supply Management (ISM) Manufacturing Index fell -0.9 point to 50.2, the lowest since May 2013 and just barely above the 50 dividing line between expansion and contraction. ISM’s export orders gauge remained at 46.5, matching the worst reading since July 2012. The Chicago Purchasing Managers Index (PMI) fell into contraction at 48.7 from 54.4. Forecasts had been for a slight downturn, but that the index would still remain in expansion (i.e., above 50). It was the PMI’s fifth time below 50 in 2015 and an accompanying note said “the speed of the September descent is a source of concern.” The reading follows other regional contraction-level readings in New York, Philadelphia, Richmond and Texas.
In Canada, industrial producer prices declined -0.3% in August, beating expectations of a -0.5% decline. For the year, prices are -0.4% lower, led by a -14.8% plunge in energy prices.
In the Eurozone, a tiny bit of recent inflation has turned back into deflation. Consumer prices went negative in September, falling -0.1% versus a year ago. It was the first negative reading in the six months since the ECB launched a bond buying program. Expectations had been for an unchanged reading.
Germany’s PMI was revised downward in September to 52.3. The average PMI for the months comprising the third quarter was 52.5, the strongest reading in more than a year, but the lower reading for September indicates a slowdown in momentum heading into the fourth quarter.
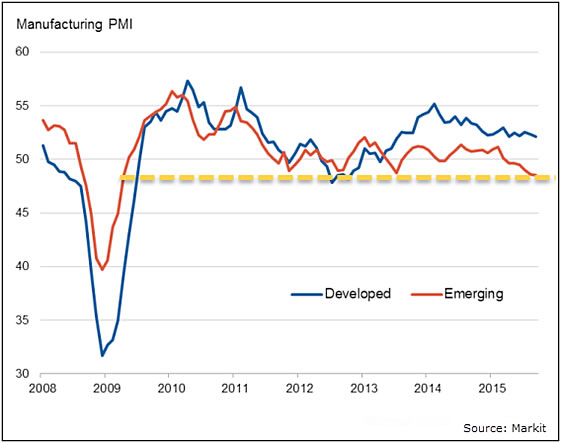
Finally, the general perception among many investors is that the place to find growth is in the Emerging Markets, which presumably are expanding more rapidly than their developed-world counterparts. Sometimes, this is a correct perception – such as during the Bull Market running from 2003 to 2007. However, it has most definitely not been true for the last couple of years. In fact, growth has turned to contraction in many Emerging Market countries, and the Manufacturing PMI readings for Emerging Markets have fallen sharply into the sub-50 contraction territory. Stock prices, too, have reflected this unhappy state, with most Emerging Markets indexes lower than their levels of 5 years ago. This chart, from Markit, shows that the Emerging Market Manufacturing PMI is now at a 6-year low and back to the same level reached in Q2 of 2009 when Emerging Markets were first exiting from the Great Recession.
(sources: Reuters, Barron’s, Wall St Journal, Bloomberg.com, ft.com, guggenheimpartners.com, ritholtz.com, markit.com, financialpost.com, Eurostat, Statistics Canada, Yahoo! Finance, stocksandnews.com, marketwatch.com, wantchinatimes.com, BBC, 361capital.com, pensionpartners.com, cnbc.com; Figs 3-5 source W E Sherman & Co, LLC)
The ranking relationship (shown in Fig. 5) between the defensive SHUT sectors (“S”=Staples [a.k.a. consumer non-cyclical], “H”=Healthcare, “U”=Utilities and “T”=Telecom) and the offensive DIME sectors (“D”=Discretionary [a.k.a. Consumer Cyclical], “I”=Industrial, “M”=Materials, “E”=Energy), is one way to gauge institutional investor sentiment in the market.
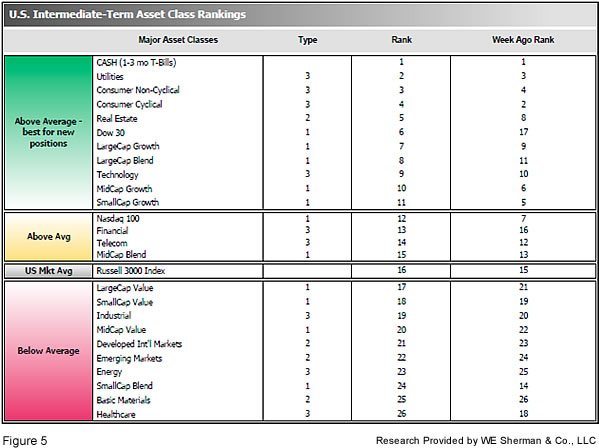
The average ranking of Defensive SHUT sectors fell to 11.3 from the prior week’s 9.3, while the average ranking of Offensive DIME sectors rose slightly to 17.8 from the prior week’s 18.3. The Defensive SHUT sectors have still maintained a sizable lead in rankings over the Offensive DIME sectors. Note: these are “ranks”, not “scores”, so smaller numbers are higher ranks and larger numbers are lower ranks.
Summary:
The US has led the worldwide recovery, and continues to be among the strongest of global markets. However, the over-arching Secular Bear Market may remain in place globally even through new highs were reached in the US earlier this year. Because the world may still be in a Secular Bear, we have no expectations of runs of multiple double-digit consecutive years, and we expect poor market conditions to be a frequent occurrence. Nonetheless, we remain completely open to any eventuality that the market brings, and our strategies, tactics and tools will help us to successfully navigate whatever happens.
Check out the latest article in the Resource area of our website:
“Hacking and Identity Theft: A Simple Step to Better Protect Yourself"

