OCT 2020 September was a "Perfect Storm"
Submitted by The Blakeley Group, Inc. on December 4th, 2020The very big picture (a historical perspective):
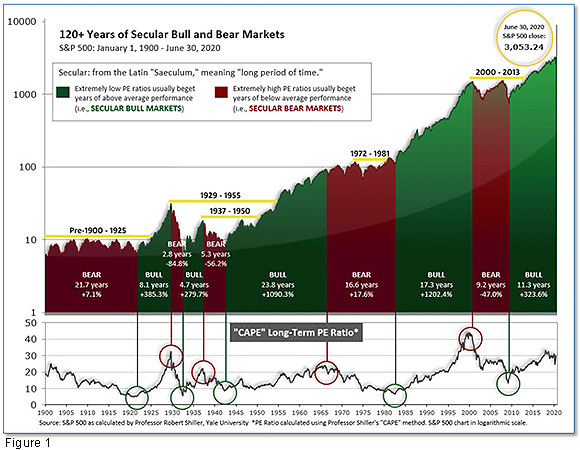
The long-term valuation of the market is commonly measured by the Cyclically Adjusted Price to Earnings ratio, or “CAPE”, which smooths-out shorter-term earnings swings in order to get a longer-term assessment of market valuation. A CAPE level of 30 is considered to be the upper end of the normal range, and the level at which further PE-ratio expansion comes to a halt (meaning that further increases in market prices only occur as a general response to earnings increases, instead of rising “just because”). The market was recently at that level.
Of course, a “mania” could come along and drive prices higher - much higher, even - and for some years to come. Manias occur when valuation no longer seems to matter, and caution is thrown completely to the wind - as buyers rush in to buy first, and ask questions later. Two manias in the last century - the “Roaring Twenties” of the 1920s, and the “Tech Bubble” of the late 1990s - show that the sky is the limit when common sense is overcome by a blind desire to buy. But, of course, the piper must be paid, and the following decade or two were spent in Secular Bear Markets, giving most or all of the mania-gains back.
The Very Big Picture: 120 Years of Secular Bulls and Bears.

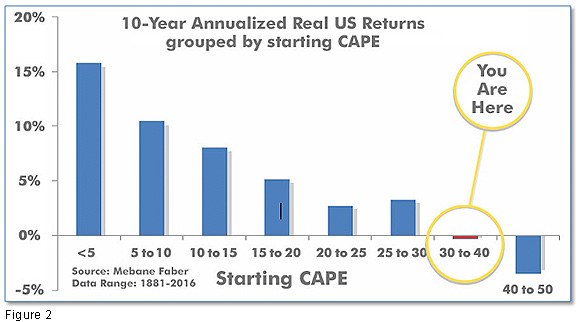
See Fig. 1 for the 100-year view of Secular Bulls and Bears. The CAPE is now at 30.68, up from the prior week’s 31.47. Since 1881, the average annual return for all ten-year periods that began with a CAPE in the 20-35 range have been slightly-positive to slightly-negative (see Fig. 2).
Note: We do not use CAPE as an official input into our methods. However, if history is any guide - and history is typically ‘some’ kind of guide - it’s always good to simply know where we are on the historic continuum, where that may lead, and what sort of expectations one may wish to hold in order to craft an investment strategy that works in any market ‘season’ … whether current one, or one that may be ‘coming soon’!
The Very Big Picture: Historical CAPE Values.
Current reading: 30.75

The big picture:
As a reading of our Bull-Bear Indicator for U.S. Equities (comparative measurements over a rolling one-year timeframe), we remain in Cyclical Bull territory.
The complete picture:
Counting-up of the number of all our indicators that are ‘Up’ for U.S. Equities (see Fig. 3), the current tally is that four of four are Positive, representing a multitude of timeframes (two that can be solely days/weeks, or months+ at a time; another, a quarter at a time; and lastly, the {typically} years-long reading, that being the Cyclical Bull or Bear status).
The Current ‘Complete Picture’: The Sum of Positive Indicators.

In the markets:
U.S. Markets: The large cap benchmarks managed to break a string of four consecutive weekly losses and moved higher, although gains were more robust in small and mid-caps. Most sectors within the S&P 500 index recorded modest positive returns, with the exception of energy stocks, which continued their declines. For the week, the Dow Jones Industrial Average added 509 points to close at 27,683, a gain of 1.9%. The technology-heavy NASDAQ Composite rose for a second week, adding 1.5%. By market cap, the large cap S&P 500 gained 1.5%, while the mid cap S&P 400 and small cap Russell 2000 surged 4.7% and 4.4%, respectively.
International Markets: International markets in the West finished the week predominantly to the upside. Canada’s TSX rebounded 0.8%, while the United Kingdom’s FTSE added 1%. On Europe’s mainland, France’s CAC 40 rose 2% along with Germany’s DAX which gained 1.8%. In Asia, China’s Shanghai Composite finished the week flat, while Japan’s Nikkei declined -0.8%. As grouped by Morgan Stanley Capital International, developed markets finished the week up 1.3%, while emerging markets added 2.4%.
Commodities: Precious metals retraced most of last week’s decline with Gold rebounding 2.2% to $1907.60 per ounce, and Silver rising 4.1% to $24.03. Crude oil fell for a second week, plunging -8% to $37.05 per barrel of West Texas Intermediate crude. The industrial metal copper, viewed by some analysts as a barometer of world economic health due to its wide variety of uses, finished the week up 0.2%.
September Summary: September wasn’t a great month for domestic equity markets. The Dow gave up -2.3%, while the NASDAQ declined -5.2%. Large caps gave up -3.9%, mid caps lost -3.4% and small caps fell -3.5%. September was also a difficult month for almost all major international indexes. Canada declined -2.4%, the UK gave up -1.6%, and France ended down -2.9%. Germany fell -1.4%, China lost -5.2%, but Japan managed a 0.2% gain. Emerging markets as a whole fell -1.0%, while developed markets as a whole gave up -2.0%. Gold fell -4.2% in September, Silver plunged a whopping ‑17.8%, oil gave up -5.6%, and copper ended the month down -1.0%.
Third Quarter Summary: Despite September’s losses, the third quarter was positive for most markets. In the U.S., all major indexes finished positive. The Dow added 7.6%, the NASDAQ rallied 11% and the S&P 500 rose 8.5%. Mid caps and small caps rose 4.4% and 4.6%, respectively. International markets were mixed for the quarter. Canada rose 3.9%, while the UK fell -4.9%. France’s CAC 40 gave up -2.7% and Germany’s DAX rose 3.7%. In Asia, China surged 7.8% and Japan added 4.0%. Emerging markets as a whole jumped 10.3% in the third quarter, while developed markets as a whole added 4.6%. Commodities likewise had a decent quarter despite September’s pullback. Gold rose 5.3%, Silver gained 26%, oil added 2.4%, and copper rose 11.2%.
U.S. Economic News: The U.S. added 661,000 jobs in September and the unemployment rate fell to 7.9%, the Bureau of Labor Statistics reported. The increase in employment fell short of the consensus forecast of 800,000 jobs added. Furthermore, the gain in hiring was the smallest since the economy reopened, pointing to a potential deceleration in the recovery. Private-sector hiring was somewhat stronger with the creation of 877,000 new jobs. A decline in public-education jobs at local schools and state colleges appeared to be the main reason for the shortfall. The unemployment rate, meanwhile, fell for the fifth month in a row to 7.9% from 8.4%, a new pandemic low. The official jobless rate had peaked at 14.7% in April before subsiding.
The number of Americans filing first-time unemployment benefits fell to a six-month low last week, hitting their lowest level since the outbreak of the coronavirus pandemic. The Labor Department reported initial jobless claims dropped to 837,000 in the week ended September 26. Economists had expected new claims to fall to 840,000. However, the report had one big caveat—California. The state is not accepting new applications until early October while it processes a large backlog and investigates reports of widespread fraud. As a result, the U.S. Labor Department is using the most recent California numbers before the pause as part of its national total. Continuing claims, which counts the number of people already receiving benefits, declined by 980,000 to a seasonally-adjusted 11.8 million. That’s also the lowest level since late March, when most of the U.S. economy was shut down.
The National Association of Realtors (NAR) reported pending home sales, which counts the number of real-estate transactions in which a contract has been signed but not yet closed, rose for a fourth consecutive month in August to a new record high. The NAR reported pending home sales rose 8.8% in its latest reading. Compared with the same time last year, contract signings were up 24%. “Tremendously low mortgage rates — below 3% — have again helped pending home sales climb in August,” Lawrence Yun, the National Association of Realtors’ chief economist, said in the report. All regions of the country rose, but the West led the way with a 13% gain.
Home-price appreciation maintained its upward trajectory in July as buyers flooded the market only to find fewer homes for sale, according to S&P/CoreLogic. S&P’s Case-Shiller 20-city home price index posted a 3.9% year-over-year gain in July. On a monthly basis, the index increased 0.6% between June and July. Phoenix led all other markets once again with a 9.2% annual price gain. That was followed by Seattle with a 7% increase and Charlotte, N.C. with 6% growth. By region, Craig Lazzara, managing director and global head of index investment strategy at S&P stated, “Prices were particularly strong in the Southeast and West regions, and comparatively weak in the Midwest and Northeast.” Overall, the pace of price growth increased in 16 of the 19 cities Case-Shiller analyzed — the 20-city list did not include Detroit once again this month because transaction records for Wayne County, Mich. were unavailable.
Confidence among the nation’s consumers rose in September to its highest level since the coronavirus pandemic began a closely followed survey showed. The Conference Board reported its index of consumer confidence jumped 15.5 points to 101.8 this month—its biggest one-month increase in 17 years. Economists had expected just a 3.3 gain. Lynn Franco, senior director of economic indicators at the board noted in the release, “A more favorable view of current business and labor market conditions, coupled with renewed optimism about the short-term outlook, helped spur this month’s rebound in confidence.” In the details of the report, the sub-index that tracks how consumers feel about the economy right now jumped to 98.5 in September from 85.8 in the prior month, and the sub-index that tracks how Americans view the next 6 months - the so-called “future expectations index” - surged to 104 from 86.6.
The record decline in the nation’s gross domestic product (GDP) in the early stages of the coronavirus pandemic was modified slightly to a -31.4% annual pace—setting the stage for a big rebound in the third quarter. The decline was previously -31.7% during the months of April, May, and June. The economy has been engaged in a comeback since the start of the summer, and GDP is expected to show a big snap-back rebound in the third quarter. Economists predict the U.S. is likely to expand at a record 25% annual clip during the July-to-September time frame. Third-quarter GDP will be released at the end of October.
Business activity in the Chicago area surged in September to its highest level since the end of 2018 according to analytics firm MNI Indicators. MNI reported its Chicago PMI business barometer jumped 11.2 points to 62.4 in September. Economists had expected a reading of 52. All five main components of the index rose in September, especially new orders and production. Both advanced to an almost two-year high in a region with a heavy concentration of auto and parts manufacturing. Car sales have been surprisingly strong as of late on the heels of record low interest rates. However, analysts were quick to point out that diffusion indexes such as the Chicago PMI only ask executives if conditions are getting better or worse—not by how much. Rubella Farooqi, Chief U.S. economist at High Frequency Economics stated in a note, “Manufacturing is still rising from low levels, but momentum has slowed in recent months.”
International Economic News: Canada’s economy continued its recovery in July with the country’s gross domestic product expanding by 3%. Statistics Canada reported that all 20 sectors of the economy grew as businesses continued to reopen and tried to get back to some sense of normal after lockdowns in March and April. Output in agriculture, utilities, finance and insurance businesses, as well as real estate rental and leasing companies, returned to where it was before the pandemic struck. Retail trade businesses accomplished the same feat the month before, in June. But despite July's growth, all other types of businesses still have yet to get back to their previous highs. Overall, GDP remains 6% below February's level, Statistics Canada said.
Across the Atlantic, Andy Haldane, chief economist at the Bank of England, warned that “contagious pessimism” in the United Kingdom is undermining the economic recovery. Official figures now show that the UK’s economy contracted 19.8% in the second quarter, compared to the previous, marginally better than the first estimate of a 20.4% decline. Mr. Haldane warned that the prospects for continued recovery would be endangered if people started “catastrophizing” by looking at the record drop rather than focusing on the bounce back since then. “Averting an economic anxiety attack calls for a balanced and flexible approach to the words and actions of businesses and policymakers,” the BoE policymaker said. “Encouraging news about the present needs not to be drowned out by fears for the future,” he added.
On Europe’s mainland, France’s government presented its 2021 budget that aims to rescue the country’s economy from the impact of the coronavirus pandemic by injecting a 42 billion-euro ($49 billion) stimulus next year. Finance Minister Bruno Le Maire said, “We are convinced that France can recover, and quickly recover.” France’s economy is expected to shrink 10% this year, in its worst recession since World War II. Earlier this month, French President Emmanuel Macron unveiled a 100 billion-euro ($117 billion) recovery plan aimed at creating jobs and saving struggling businesses. “By the end of 2021, we want to release 42 billion euros of these funds, so nearly half of it, in order to have quick economic results,” Le Maire said. The government hopes the economy will grow 8% next year, boosted by the recovery plan.
Germany’s central bank – the Bundesbank – warned that a “big shock” is still to come to its economy. Bundesbank Member of the Executive Board Joachim Wuermeling warned that the "biggest shock is still to come." He said that it was very difficult to forecast the timing, with economies under pressure to "get off the lifeline of the extraordinary stimulus". "We expect the biggest waves in autumn and the beginning of next year, but it could also be extended into the whole of next year." Last month, Jens Weidmann, president of the Bundesbank, warned that the EU economy risked becoming overly reliant on the massive fiscal and monetary support provided since the coronavirus pandemic struck.
China’s economy continued to gather more steam in September as a rebound in global demand and the government’s supportive measures bolstered factory activity. China’s National Bureau of Statistics reported its official manufacturing purchasing managers index (PMI) rose 0.5 points to 51.5 for the month of September. Economists had expected a reading of 51.2. A separate private gauge of manufacturing activity, the Caixin China manufacturing PMI, stood at a robust 53.0, roughly in line with the previous month’s level. Furthermore, China’s official non-manufacturing (service sector) PMI jumped to 55.9, its highest reading since November 2013.
Business sentiment in Japan is recovering more slowly than expected, a worrying sign that Japan’s economic recovery may be further delayed. The closely watched Tankan survey of large manufacturers rose by only seven points from -34 to -27 in the third quarter, compared with consensus expectations of -23. The figures suggest Japanese companies are still struggling and the shock from Covid-19 is turning into a more traditional economic downturn. Japan’s economy shrank by a record 7.9% in the second quarter of 2020, but there were hopes for a rapid rebound since Covid-19 is largely under control in East Asia. Still, some analysts like Takeshi Yamaguchi at Morgan Stanley in Tokyo argued that the Tankan was more encouraging than the headline figure suggested. Yamaguchi wrote, “We think the direction of change is more important than the level,” arguing that the economy had shifted into the early stages of a recovery.
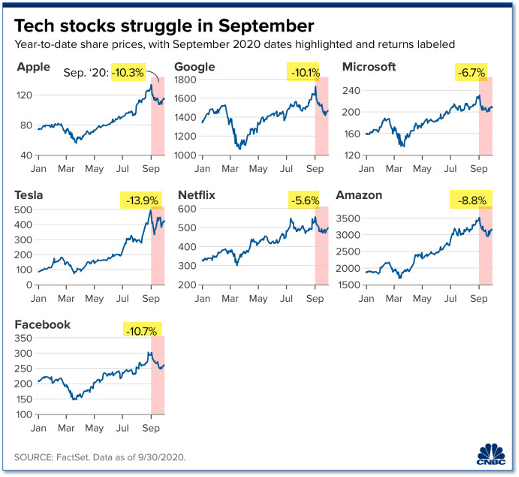
Finally: As September came to a close analysts described the NASDAQ’s performance as a “perfect storm” and “a ‘Nightmare on Elm Street’ month”. The NASDAQ, which gets about 40% of its value from just a handful of technology stocks, lost more than 5% in September. Apple, which had managed to weather the Covid-19 pandemic relatively unscathed, closed down -10.25% from the closing price on Aug. 31. Prudential Financial chief market strategist Quincy Krosby stated, “There were many elements in the market this September that aligned themselves to basically go from an overbought situation for the mega cap tech names to now become oversold.” A graphic summary of the September carnage in many of the leading mega-tech stocks are shown below. (chart: CNBC.com)

(Sources: All index- and returns-data from Yahoo Finance; news from Reuters, Barron’s, Wall St. Journal, Bloomberg.com, ft.com, guggenheimpartners.com, zerohedge.com, ritholtz.com, markit.com, financialpost.com, Eurostat, Statistics Canada, Yahoo! Finance, stocksandnews.com, marketwatch.com, wantchinatimes.com, BBC, 361capital.com, pensionpartners.com, cnbc.com, CNBC, FactSet.)

