NOV 2016: Uncertainty
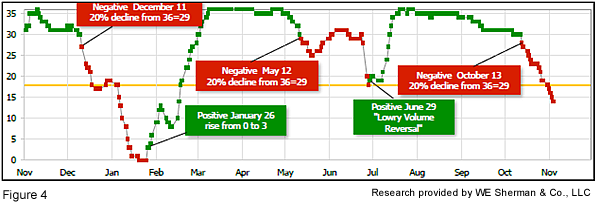
Submitted by The Blakeley Group, Inc. on November 12th, 2016Please look at the last page on Fig. 4, the ranking is at a 14 and a reversal will be in taken when the ranking is 17. Stay tuned and we will see which direction the portfolio needs/should be positioned.
The Blakeley Group has a briefing paper from Nuveen Market Commentary entitled “Presidential Elections and Market Performance: A Historical View”. Please email Sean at our office if you would like a copy of the briefing paper emailed to you.
Conclusion from the briefing paper:
“Election years tend to cause heightened awareness of the impact of political decisions on financial markets. A historical perspective on market performance throughout the election cycle and an appreciation for the political context in which planning decisions are made can bring additional insight to help investors achieve their goals and objectives.”
Best Regards,
- Dick Blakeley -
NOTE: Areas with blue text show the most recent market updates since the October Capital Highlights email.
In the "decades" timeframe, the question of whether we are in a continuing Secular Bear Market that began in 2000 or in a new Secular Bull Market has been the subject of hot debate among economists and market watchers since 2013, when the Dow and S&P 500 exceeded their 2000 and 2007 highs. The Bear proponents point out that the long-term PE ratio (called “CAPE”, for Cyclically-Adjusted Price to Earnings ratio), which has done a historically great job of marking tops and bottoms of Secular Bulls and Secular Bears, did not get down to the single-digit range that has marked the end of Bear Markets for a hundred years, but the Bull proponents say that significantly higher new highs are de-facto evidence of a Secular Bull, regardless of the CAPE. Further confusing the question, the CAPE now has risen to levels that have marked the end of Bull Markets except for times of full-blown market manias. See Fig. 1 for the 100-year view of Secular Bulls and Bears.
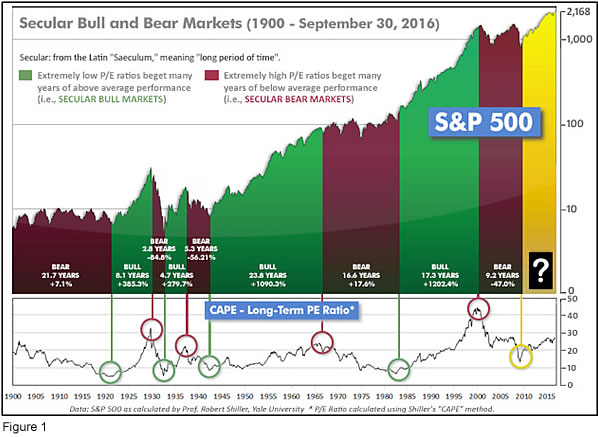
Even if we are in a new Secular Bull Market, market history says future returns are likely to be modest at best. The CAPE is at 25.82, down from the prior week’s 26.33, and only a little lower than the level reached at the pre-crash high in October, 2007. Since 1881, the average annual return for all ten year periods that began with a CAPE around this level have been just 3%/yr (see Fig. 2).
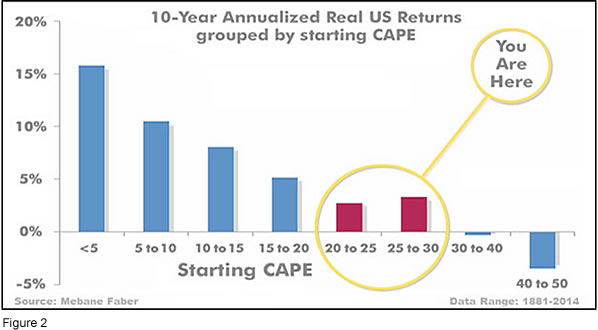
This further means that above-average returns will be much more likely to come from the active management of portfolios than from passive buy-and-hold. Although a mania could come along and cause the CAPE to shoot upward from current levels (such as happened in the late 1920’s and the late 1990’s), in the absence of such a mania, buy-and-hold investors will likely have a long wait until the arrival of returns more typical of a rip-snorting Secular Bull Market.
In the big picture:
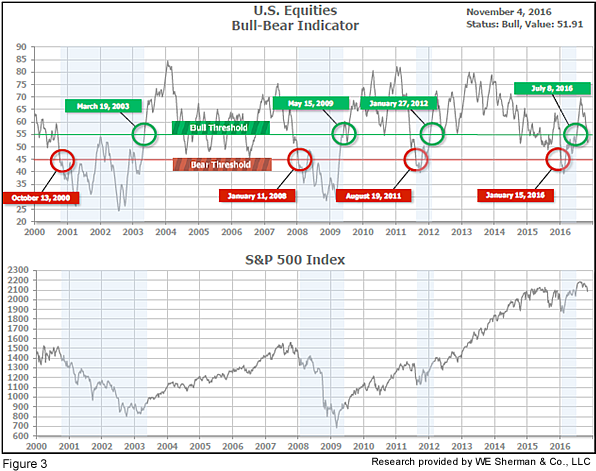
The “big picture” is the months-to-years timeframe – the timeframe in which Cyclical Bulls and Bears operate. The U.S. Bull-Bear Indicator (see Fig. 3) is in Cyclical Bull territory at 51.91, down sharply from the prior week’s 55.20.
In the intermediate picture:
The Intermediate (weeks to months) Indicator (see Fig. 4) turned negative on October 14th. The indicator ended the week at 14, down from the prior week’s 19. Separately, the Quarterly Trend Indicator - based on domestic and international stock trend status at the start of each quarter – was positive entering October, indicating positive prospects for equities in the fourth quarter of 2016.
Timeframe summary:
In the Secular (years to decades) timeframe (Figs. 1 & 2), whether we are in a new Secular Bull or still in the Secular Bear, the long-term valuation of the market is simply too high to sustain rip-roaring multi-year returns. The Bull-Bear Indicator (months to years) is positive (Fig. 3), indicating a potential uptrend in the longer timeframe. The Quarterly Trend Indicator (months to quarters) is positive for Q4, and the Intermediate (weeks to months) timeframe (Fig. 4) is negative. Therefore, with two of three indicators positive, the U.S. equity markets are rated as Mostly Positive.
In the markets:
Markets were down around the world as heightened uncertainty surrounding the upcoming Presidential election appeared to weigh on sentiment. The S&P 500 recorded its ninth consecutive daily decline, a streak not seen since 1980, and ended the week down -1.94%. The Dow Jones Industrial Average fell -272 points to close at 17,888, a loss of -1.50%. The tech-heavy NASDAQ Composite fell -143 points (-2.77%), the worst of the major averages. The MidCap S&P 400 index dropped -1.4%, and the SmallCap Russell 2000 fell -2%.
In international markets, Canada’s TSX joined the American markets by ending the week down -1.9%. Across the Atlantic, the declines were more substantial. The United Kingdom’s FTSE plunged ‑4.3%, France’s CAC 40 fell ‑3.8% and Germany’s DAX that was off ‑4.1%. Italy’s Milan FTSE retraced 6 straight weeks of gains by plunging -5.8%. In Asia, China’s Shanghai Stock exchange was among the few bright spots in the world, rising +0.68%, but Japan’s Nikkei fell ‑3.1% and Hong Kong’s Hang Seng retreated -1.4%. Developed international markets as a group, as measured by the MSCI EAFE Index, fell -2.1% while emerging markets as a group, as measured by the MSCI Emerging Markets Index, fell -2.7%.
In commodities, precious metals experienced their fourth week of gains as Gold rose +2.2% to $1,304.50 an ounce. Silver rallied +3.2% and closed at $18.37 an ounce. The industrial metal copper had a second week of solid gains, ending the week up +3.3%. West Texas Intermediate crude oil had its second consecutive down week, plunging -9.5% to $44.07 per barrel, as OPEC members continue to quarrel amongst themselves over proposed production restraints that appear less and less likely to take effect.
In U.S. economic news, the country added 161,000 new jobs last month, pushing the unemployment rate down to nearly an 8-year low of 4.9%. Analysts see the increase in hiring as a sign that the economic recovery still continues despite weakness earlier in the year. Education and health services, professional and business services, and financial activities led the hiring. One facet of the improved labor market is that firms have been forced to raise wages to fill open positions. In addition, executives continue to have difficulty finding skilled employees. The effect is that many companies have been forced to boost pay to attract or retain qualified workers. Hourly pay for the typical employee rose +0.4% last month to $25.92, a gain of +2.8% over the past year. The less-cited broader measure of unemployment, known as the U-6 rate, fell -0.2% to 9.5%. The U-6 rate includes part-time workers who can’t find full-time positions and those jobseekers who have given up looking for work. Although elevated, the U-6 rate continues to trend down.
The Labor Department reported that the number of people who applied for new unemployment benefits rose +7,000 to 265,000, a 3-month high. Despite the increase the overall rate of layoffs remains relatively low. Initial claims for unemployment dropped to a 43-year low of 246,000 in early October before turning higher the last few weeks. Still, claims have remained below the key 300,000 threshold for over a year and a half.
The private sector added the fewest number of jobs in almost half a year according to payroll processer ADP. Employers added 147,000 private sector jobs last month, missing expectations for a gain of 170,000. Mark Zandi, chief economist at Moody’s Analytics stated that the pace of job growth appears to be slowing. “Behind the slowdown is businesses’ difficulty filling open positions. However, there is some weakness in construction, education, and mining,” he said. In the details of the report, small private-sector businesses added 34,000 jobs, medium businesses added 48,000, and large businesses added 64,000. All of the gains were in the service sector where 165,000 jobs were added. Manufacturing lost 1,000 jobs last month.
American consumers increased their spending last month, but overall consumer spending for the third quarter remained tepid. The Commerce Department reported that spending rose +0.5% in September, but that followed a negative reading in August and a downwardly-revised gain in July. Gains were broad as Americans bought more cars and other durable goods, and spent more on gasoline, rent, eating out, and health care. Overall consumer spending for the 3rd quarter grew at a more modest +2.1%, following a +4.3% advance in the 2nd quarter.
A rise in consumer prices also pushed up the rate of inflation over the past year to +1.2%, as measured by the Personal Consumption Expenditures Index (the Federal Reserve’s preferred inflation gauge). The rise in inflation is starting to impact consumers, as after-tax income was flat for a second consecutive month. Excluding inflation, incomes rose +0.3% while the savings rate fell slightly to 5.7%.
The Federal Reserve indicated that the time for an interest-rate hike is approaching and that it doesn’t need much additional evidence before acting. The Fed policy committee voted 8 to 2 to maintain interest rates in the 0.25% to 0.5% range. The lack of a move was widely expected and there was little response in the financial markets. According to the statement, “The committee judges that the case for an increase in the federal funds rate has continued to strengthen but decided, for the time being, to wait for some further evidence of further progress toward its objectives.” The general consensus among analysts is that the Fed will be ready to hike interest rates at its meeting on December 13-14, barring any shocks from economic data or financial markets. There is also belief that the Fed didn’t want to make a move just days away from the presidential election to avoid placing the central bank into the political landscape.
Spending for construction projects fell -0.4% last month, according to the Commerce Department. The drop surprised economists who had expected growth of +0.4%. On an annual basis, the $1.15 trillion spent on both residential and non-residential projects was -0.2% less than a year ago—the first year-over-year decline in five years. In September, overall spending on private construction projects fell -0.2%. Residential spending rose +0.5%, but was offset by a -1% drop in nonresidential projects. Spending on public construction projects fell ‑0.9%.
Factory activity in the Chicago area slowed a bit, suggesting the overall economy lost some momentum in the 3rd quarter. The Chicago Purchasing Managers Index (PMI) fell -3.6 points to 50.6 last month, the lowest level since May. The decline was led by a slowdown in production, which dropped to 54.4 from 59.8. New orders also fell to the lowest level since May. The prices paid index rose to its highest level since fall of 2014, another indication that inflation is starting to pick up.
Despite the Chicago-area report, however, nationwide manufacturing activity accelerated last month according to the Institute for Supply Management’s (ISM) manufacturing index, which rose to 51.9. The reading was the highest in 3 months and up +0.4% from September. Readings above 50 indicate more companies are growing instead of shrinking. In the details of the report, new orders, production, employment, and new export orders all remained in expansion, with only new orders growing at a slower pace. New orders are used by analysts to estimate future demand. A slower pace of new orders suggests that companies remain cautious, especially with the U.S. presidential election less than a week away.
The Commerce Department reported that U.S. factory orders rose for the 3rd consecutive month, rising a seasonally-adjusted +0.3%. However, that was down from a +0.4% reading in August. Economists had expected a +0.2% gain. However, despite the string of increases, factory orders were still down -2.3% on an annual basis. Manufacturing accounts for about 12% of the economy, and has been under pressure from a stronger U.S. dollar and weakening global demand. Factories also reported a slowdown in new orders, which will weigh on manufacturing activity into the near future.
Firms and employees boosted their productivity in the 3rd quarter, surging to a 3.1% annual pace. It’s the first gain since the fall of last year, and the largest advance in 2 years. The improvement was due to a significant increase in the amount of goods and services produced, far more an increase in the amount of time workers put on the job. The Labor Department reported that the output of goods and services rose +3.4%, while the amount of time employees worked was up only +0.3%. Despite the improvement, productivity has grown less than half its historical average during the economic recovery. Since 2007, productivity has barely risen +1% annually. Going back to 1945, productivity has averaged an annualized growth rate of +2.2%.
The Canadian economy added 44,000 new jobs last month, but the jobless rate remained at 7% because more people were also looking for work. Statistics Canada reported that the great majority of the jobs came from Ontario and British Columbia where +25,000 and +15,000 new jobs were added, respectively. Most other provinces were essentially unchanged. The results were welcome news for economists who had forecasted a decline of -15,000 jobs. However, most of the gains were in part-time jobs where +67,000 new positions were added, while full-time jobs lost -23,000 during the month.
Across the Atlantic, the British government has vowed to appeal a High Court ruling that it must seek parliament’s approval before starting talks to exit the EU. The judgement will most likely delay “Brexit”, the British exit from the European Union. Three senior judges ruled that Prime Minister Theresa May’s government does not unilaterally have the power to trigger Article 50 of the EU’s Lisbon Treaty, the formal notification of intention to leave the bloc. May had promised to begin the process by the end of March, but the court’s decision raises the probability of a protracted parliamentary fight instead.
In Germany, a very solid Purchasing Managers’ Index (PMI) reading and the fastest job creation in 5 years reinforced Germany’s place as the economic powerhouse of the Eurozone. Services rebounded last month, helping the private sector to expand at the second-fastest monthly rate this year. The PMI jumped to 55.1, up +2.3 points from September. The reading was in line with estimates and remained comfortably above the 50 line that indicates growth. The main driver was an increase in the service sector after 2 weak summer months. Markit economist Oliver Kolodseike said, "Solid improvements in new business inflows and employment levels contributed to the upturn and underline that the domestic economic fundamentals in Germany are healthy as we start the final quarter."
By contrast, Italian statistics agency ISTAT reported there are no signs to suggest Italy’s economy will accelerate in the final quarter this year. GDP in the Eurozone’s 3rd largest economy stagnated in the 2nd quarter, but most economists are expecting modest growth for the 3rd quarter. ISTAT’s latest monthly economic note gave no forecast for the 3rd quarter but did state its composite leading indicator "does not signal any prospect of an acceleration in the final months of the year." Prime Minister Matteo Renzi maintains a forecast of a 0.8% growth rate in 2016.
In Asia, analysts are becoming increasingly concerned about growing debt loads and a potential real estate bubble in China that threatens to weigh heavily on growth in Asia, and which could be a drag on the entire global economy if it bursts. In September, chief economist of the People’s Bank of China, Ma Jun, argued that the Chinese government must take steps to suppress excessive real estate speculation. ”Measures should be taken to put a brake on the excessive bubble expansion in the property sector, and we should curb excessive financing into the real estate sector,” Ma said.
In Japan, the world’s 3rd largest economy is expected to have grown at an annualized rate of +0.9% in the third quarter, according to a poll of 22 economists. Hidenobu Tokuda, senior economist at Mizuho Research Institute stated, "The economy is escaping from a lull but we cannot say it returned to a track of sustainable growth because private spending and capital expenditure remained low.” Private consumption, which makes up roughly 60% of GDP, was believed to have stalled after improving the previous two quarters. Capital spending was seen up a slight +0.1%, the first increase in 3 quarters.
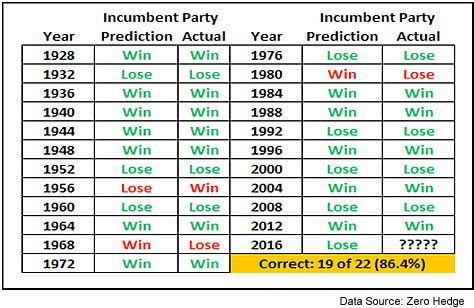
Finally, can the financial markets give a clue as to whether the incumbent or challenger has the better chance of winning a Presidential election? The answer is: probably! Financial blog Zero Hedge published a study this week that showed that market performance in the 3 months leading up to a Presidential Election has displayed “an uncanny ability to forecast who will win the White House”. Since 1928 there have been 22 elections. In 14 of them, the S&P 500 index was up during the 3 months prior to the election. The incumbent won in 12 of those 14 instances. Conversely, in 7 of the 8 elections where the S&P 500 was down in the 3 months prior to the election, the incumbent party lost. The market has thus been correct 86.4% of the time in forecasting the election. With the S&P 500 down about -4% in the last 3 months, this measure says the incumbents – the Democrats – will lose. We caution, this an observation and is not predictive. This observation may not differ significantly more than the old "The NFL wins the super bowl and the stock market will rise that year".
Sources: all index return data from Yahoo Finance; Reuters, Barron’s, Wall St Journal, Bloomberg.com, ft.com, guggenheimpartners.com, ritholtz.com, markit.com, financialpost.com, Eurostat, Statistics Canada, Yahoo! Finance, stocksandnews.com, marketwatch.com, wantchinatimes.com, BBC, 361capital.com, pensionpartners.com, cnbc.com, FactSet; Figs 1-5 source W E Sherman & Co, LLC)
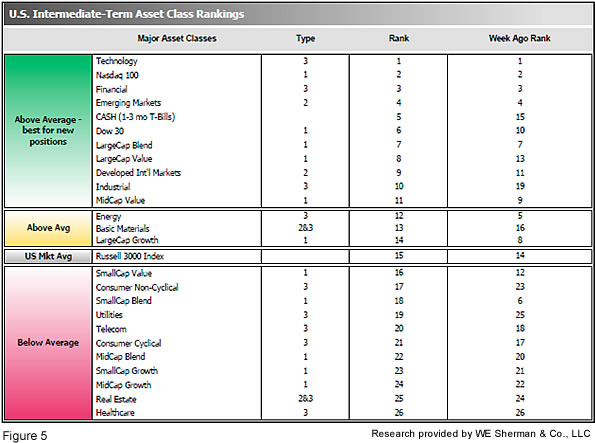
The ranking relationship (shown in Fig. 5) between the defensive SHUT sectors ("S"=Staples [a.k.a. consumer non-cyclical], "H"=Healthcare, "U"=Utilities and "T"=Telecom) and the offensive DIME sectors ("D"=Discretionary [a.k.a. Consumer Cyclical], "I"=Industrial, "M"=Materials, "E"=Energy), is one way to gauge institutional investor sentiment in the market. The average ranking of Defensive SHUT sectors rose to 20.25 from 23.0, while the average ranking of Offensive DIME sectors rose slightly to 14.0 from the prior week’s 14.25. The Offensive DIME sectors continue to lead Defensive SHUT sectors. Note: these are “ranks”, not “scores”, so smaller numbers are higher ranks and larger numbers are lower ranks.

