NOV 2018: Historical view on Mid-market Election
Submitted by The Blakeley Group, Inc. on December 20th, 2018Two months ago we introduced Wealth Management Insights, which comes out mid-month. This month’s report is on Multi-Generational Family Meetings. A family meeting can be a place to educate and promote sound financial decision making, to identify shared financial values and to maintain and grow family wealth in a unified manner.
If you think you and your family could potentially benefit from family meetings, call Shaina at 408-459-4911 to set a meeting to explore the topic further.
NOTE: Areas with blue text show the most recent market updates since the December Capital Highlights email.
The very big picture:
In the "decades" timeframe, the current Secular Bull Market could turn out to be among the shorter Secular Bull markets on record. This is because of the long-term valuation of the market which, after only eight years, has reached the upper end of its normal range.
The long-term valuation of the market is commonly measured by the Cyclically Adjusted Price to Earnings ratio, or “CAPE”, which smooths out shorter-term earnings swings in order to get a longer-term assessment of market valuation. A CAPE level of 30 is considered to be the upper end of the normal range, and the level at which further PE-ratio expansion comes to a halt (meaning that increases in market prices only occur in a general response to earnings increases, instead of rising “just because”).
Of course, a “mania” could come along and drive prices higher – much higher, even – and for some years to come. Manias occur when valuation no longer seems to matter, and caution is thrown completely to the wind as buyers rush in to buy first and ask questions later. Two manias in the last century – the 1920’s “Roaring Twenties” and the 1990’s “Tech Bubble” – show that the sky is the limit when common sense is overcome by a blind desire to buy. But, of course, the piper must be paid and the following decade or two are spent in Secular Bear Markets, giving most or all of the mania gains back.
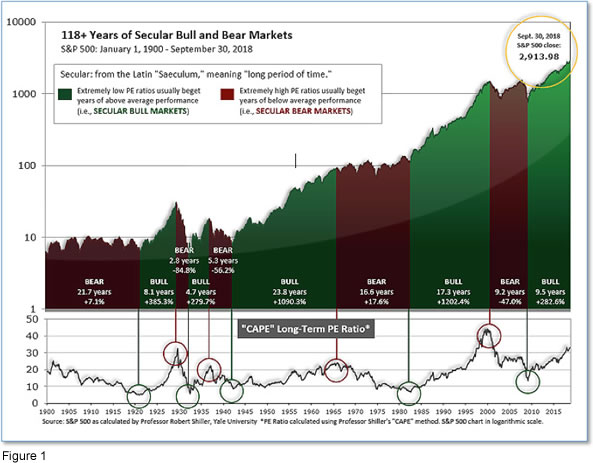
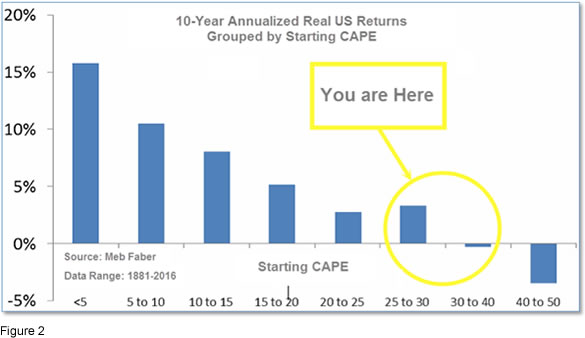
See Fig. 1 for the 100-year view of Secular Bulls and Bears. The CAPE is now at 30.71, up from the prior week’s 30.00, and exceeds the level reached at the pre-crash high in October, 2007. This value is in the lower end of the “mania” range. Since 1881, the average annual return for all ten year periods that began with a CAPE around this level have been in the 0% - 3%/yr. range. (see Fig. 2).
In the big picture:
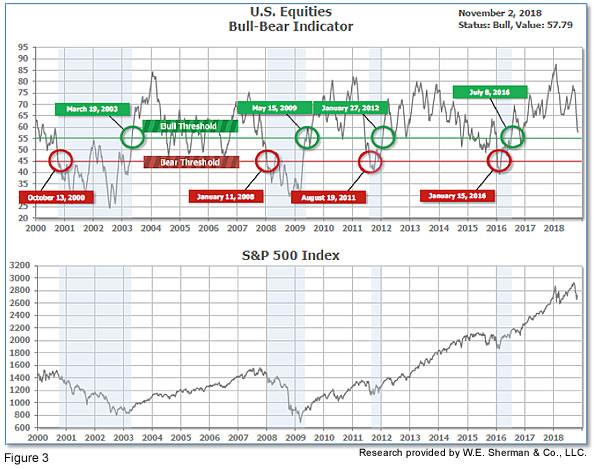
The “big picture” is the months-to-years timeframe – the timeframe in which Cyclical Bulls and Bears operate. The U.S. Bull-Bear Indicator (see Fig. 3) is in Cyclical Bull territory at 57.79, down from the prior week’s 58.57.
In the intermediate and Shorter-term picture:
The Shorter-term (weeks to months) Indicator (see Fig. 4) turned positive on April 3rd. The indicator ended the week at 10, up sharply from the prior week's 2. Separately, the Intermediate-term Quarterly Trend Indicator - based on domestic and international stock trend status at the start of each quarter – was positive entering October, indicating poor prospects for equities in the fourth quarter of 2018.

Timeframe summary:
In the Secular (years to decades) timeframe (Figs. 1 & 2), the long-term valuation of the market is simply too high to sustain rip-roaring multi-year returns – but the market has entered the low end of the “mania” range, and all bets are off in a mania. The only thing certain in a mania is that it will end badly…someday. The Bull-Bear Indicator (months to years) is positive (Fig. 3), indicating a potential uptrend in the longer timeframe. In the intermediate timeframe, the Quarterly Trend Indicator (months to quarters) is positive for Q4, and the shorter (weeks to months) timeframe (Fig. 4) is positive. Therefore, with all three indicators positive, the U.S. equity markets are rated as Positive.
In the markets:
U.S. Markets: U.S. stocks recorded solid gains for the week. The Dow Jones Industrial Average rallied 582 points, or 2.4%, ending the week at 25,270. Despite a weak close on Friday and disappointing earnings from tech-bellwether Apple, the technology-heavy Nasdaq Composite gained 2.7%, closing at 7,356. By market cap, it was the smaller cap weighted indexes that outperformed with the small cap Russell 2000 surging 4.3% and the mid cap S&P 400 adding 3.8%, while the large cap S&P 500 rose 2.4%.
International Markets: Major international markets retraced much of last week’s losses. Canada’s TSX added 1.6% and the United Kingdom’s FTSE gained 2.2%. On Europe’s mainland, France’s CAC 40 rose 2.7%, and Germany’s DAX gained 2.8%. In Asia, China’s Shanghai Composite rose 3.0% while Japan’s Nikkei surged 5.0%. As grouped by Morgan Stanley Capital International, developed markets rose 3.1%, while emerging markets surged a big 5.6%.
Commodities: Gold was weaker last week in the face of strength in the financial markets, finishing down -0.2%, at $1233.30 an ounce. Silver,though, rose 0.4% to $14.76 an ounce. Oil had its fourth consecutive down week losing ‑6.6%, ending the week at $63.14 per barrel of West Texas Intermediate. The industrial metal copper, seen as a barometer of global economic health due to its variety of industrial uses, added 2.4%.
October Summary: Stock markets worldwide had a lousy month. In the US, the Dow Jones Industrial Average and NASDAQ gave up -5.1% and -9.2%, respectively, the S&P 500 fell -6.9%, the S&P 400 retreated -9.6% and the Russell 2000 finished the month down -10.9%. International markets were no better. Canada’s TSX fell -6.5%, the UK’s FTSE gave up -5.1%, France’s CAC 40 lost -7.3%, and Germany’s DAX finished -6.5% lower. In Asia, China’s Shanghai Composite fell -7.7% and Japan’s Nikkei lost -9.1%. As grouped by Morgan Stanley Capital International, developed markets finished -8.1% lower, while emerging markets were off -8.8%. Precious metals were mixed: gold added 1.6%, while silver fell -2.9%, oil plunged over -10.8% and copper finished the month down -5.2%.
U.S. Economic News: The number of Americans seeking new unemployment benefits fell slightly in late October, remaining near their lowest levels in decades. The Labor Department reported Initial Jobless Claims fell by 2,000 to 214,000 last week. The reading was a bit higher than the 212,000 forecasted by economists. The more stable monthly average of new claims rose by 1,750 to 213,750. New jobless claims have held below 220,000 since July, an incredibly low level reflecting the healthiest labor market since the late 1960’s. Meanwhile, the number of people already collecting unemployment benefits declined by 7,000 to 1.63 million. That number is at its lowest level in 45 years.
Private payrolls jumped the most in eight months in October, according to private payrolls processor ADP. ADP reported payrolls increased by 227,000 last month, far higher than consensus estimates of 180,000. In the details, large businesses led the hiring by adding 102,000 positions. Mid-sized businesses added 96,000, while small employers added 29,000. Analysts note that small employers have difficulty competing for available workers against mid and large sized firms, which are better positioned to offer the compensation and benefits that workers seek. By sector, 61,000 jobs were added in the category of trade, transportation and utilities. The next top performing category was leisure and hospitality, which reported 40,000 new jobs. Ahu Yildirmaz, co-head of the ADP Research Institute stated, “Despite a significant shortage in skilled talent, the labor market continues to grow. We continue to see larger employers benefit in this environment as they are more apt to provide the competitive wages and strong benefits employees desire.”
The Bureau of Labor Statistics reported in its monthly Non-Farms Payroll (NFP) report that the US added 250,000 jobs in October, blowing away consensus expectations of 188,000 new jobs. The gains were broad-based across industries. Services payrolls rose 179,000 while goods-producing payrolls rose by 67,000. Furthermore, the unemployment rate held near a 48-year low of 3.7% - the lowest rate since 1969. There was no evidence of slowing jobs growth in the NFP report. Long-missing wage growth finally showed up, with take-home pay for workers climbed more than 3% over the past 12 months. Analysts note that the widespread growth in this report should keep the Fed on its normalization path, with the next rate hike to occur in December.
Home prices rose just 0.1% and annual home price gains were their smallest in almost two years, according to the latest data from S&P/Case-Shiller. The Case-Shiller National Home Price Index rose 0.6% in August, but analysts noted its year-over-year change moderated to just a 5.8% gain—its slowest pace since May of last year. In addition, metro areas showed more weakness than the overall market. Case-Shiller’s more narrowly-focused 10 and 20-city indexes ticked up just 0.1% each, with their year-over-year increases moderating to 5.2% and 5.5%, respectively. The softening is in line with other housing market activity data that show rising mortgage rates have weighed on demand.
Confidence among the nation’s consumers continued to rise in October, hitting its highest level in the last 18 years even in the face of the recent stock market volatility. The Conference Board reported its Consumer Confidence Index rose 2.6 points to 137.9 in October, close to its record high of 144.7 set in May of 2000. A measure of how Americans view the economy right now, called the “present situation index”, rose 3.4 points to 172.8—also an 18-year high. The measure of what Americans think the economy will look like six months from now, called the “future expectations index”, also hit an 18-year high of 114.6. Confidence was mixed by demographic and income categories, but generally continued to trend up across the board. Lynn Franco, director of economic indicators at the board, said “Consumers’ assessment of present-day conditions remains quite positive, primarily due to strong employment growth.”
The Institute for Supply Management (ISM) reported its manufacturing index fell 2.1 points last month to 57.7, the lowest level since April. The reading was below consensus expectations for just a 0.9 point pullback. Overall, the decline is rather moderate and its current level remains consistent with above-trend economic expansion (numbers greater than 50 indicate expansion). Of the 18 industries in the ISM October survey, 13 reported growth. In the report’s components, four of five declined, led by a 4.4 point drop in new orders. The only component that rose was supplier deliveries, up 2.7 points to 63.8, a level that suggests upward pressure on prices. Notably, the price index rose 4.7 points to 71.6 as cost pressures increased. One purchasing manager in computer and electronic products stated, “All electronic components are having shortages and much longer lead times and that impacts our production.”
Americans bought more vehicles and recreational goods last month as consumer spending rose for a seventh consecutive month, reported by the Commerce Department which said consumer spending climbed 0.4%. However, it was also reported that incomes were up just 0.2% - their smallest increase in just over a year. Notably, inflation appears to remain under control. The Federal Reserve’s preferred inflation gauge, the Personal Consumption Expenditures (PCE) Index rose just 0.1% in September, bringing the annual rate down from 2.2% to 2%. In a note to clients, Citibank economist Andrew Hollenhorst wrote, “September personal consumption data largely confirm what we knew after the release of third quarter GDP – consumption was strong and inflation remains subdued.”
International Economic News: Canada’s unemployment rate fell to four-decade lows, as the economy added 11,200 jobs in October. Statistics Canada reported Canada’s jobless rate ticked down to 5.8% and that the economy has added almost 206,000 new jobs over the past year. However, despite the lower jobless rate and slight uptick in jobs, economist Brian DePratto with Toronto-Dominion bank said that the report showed some reason for concern. DePratto noted the decline in the unemployment rate was for the wrong reason: fewer Canadians in the labor force. “Not an encouraging sign”, he wrote. The economy added almost 34,000 full-time jobs during the month, but that was partially offset by a loss of 22,600 part-time positions. A separate trade report continued to show sluggish flows in September, with both exports and imports recording back-to-back monthly drops. The numbers reveal a lukewarm economy, one that is unlikely to convince the Bank of Canada that a faster pace of rate increases is needed.
Britain’s Finance Minister Philip Hammond stated the United Kingdom economy would grow 1.6% in 2019, an increase of 0.3% over previous estimates. But Hammond also downgraded the U.K.’s 2018 growth estimate from 1.5% to 1.3%, citing uncertainty over terms for Britain’s withdrawal from the European Union. He said the nation's "resolute" focus was to prosper outside the EU following its departure on March 29 next year, adding that the austerity era that began at the height of the global financial crisis in 2008 was "finally coming to an end". With much uncertainty surrounding Britain's EU exit, Hammond said the government was increasing its Brexit preparation fund to 4.2bn pounds ($5.4bn), a hike of 500m pounds ($639m). Talks between London and Brussels have stalled and it remains uncertain whether British Prime Minister Theresa May will strike a deal acceptable to British members of parliament.
French statistics agency INSEE stated the economy expanded 0.4% in the third quarter due to higher consumer spending and manufacturing. The reading was twice the pace recorded in the first two quarters of the year and welcome news to French President Emmanuel Macron. Macron has enacted a series of pro-business economic reforms since coming to power in May 2017, but since then has struggled to convince voters that the reforms are working as sluggish growth and stubbornly high unemployment have continued. Philippe Waechter, an economist at Ostrum Asset Management, said he believed French growth in 2018 would fail to match the level of 2017 when it hit 2.2%. "The economy lacks sources of impulsion and indicators suggest month after month that 2017 was an exception," he said.
China’s ruling Communist Party sent a strong message this week, saying it will significantly alter its economic policy course. The change is in response to growing economic headwinds due to trade tensions with the United States. The shift was signaled in a statement after a meeting of the Politburo, which analysts noted was an important change in tone compared to the previous statement. Past Politburo statements emphasized the “three battles” – of financial risk control, poverty alleviation and pollution curbs – that formed the core elements of President Xi Jinping’s economic plan. This week’s statement expressed concerns about “growing downward pressure” on the economy from a hostile international environment and noted “many difficulties with certain enterprises and the emergence of risks accumulated over long periods of time”.
The Bank of Japan downgraded its inflation and economic growth forecasts for the next year, acknowledging that its 2% inflation target may have been too aggressive. In the short term, the central bank also estimated that inflation for the current fiscal year would rise by only 0.9%, down from the 1.1% it estimated in July. In an overwhelming vote, the board voted to keep monetary policy unchanged. In his statement, Governor Haruhiko Kuroda denied that the revisions represented a large shift in the bank’s outlook but acknowledged “latent” global risks could weigh on domestic growth and price inflation. “We are paying attention to the downside risks that affect the world economy and trade,” said Kuroda, listing the U.S. normalization of interest rates, geopolitical risks in Europe and fears over financial stability in developing markets as specific risks that could potentially damage Japan’s economy.
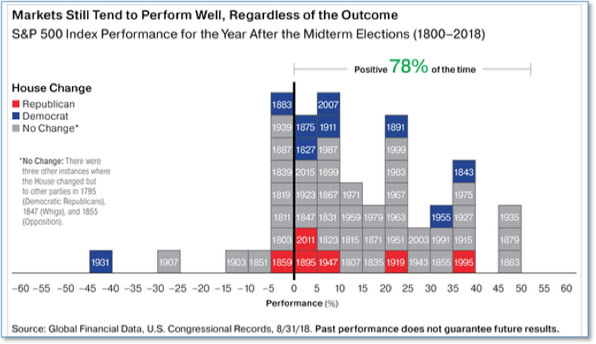
Finally: Mutual fund company Oppenheimer released a research note regarding midterm elections and their effects on the market. They note that midterm elections rarely favor the political party of the sitting President. Their research notes the party of the President almost always loses House and Senate seats in the first midterm election, even if the President is relatively popular. Many investors fear that if Republicans lose control of the House it would derail President Trump’s pro-business agenda and bring an end to the current historic bull market. However, the Oppenheimer report showed that of the 15 times that the House changed the party in control at midterm elections, 12 (or 80%) of the following years were positive, and that overall 78% of the years following midterm elections were positive.
(sources: all index return data from Yahoo Finance; Reuters, Barron’s, Wall St Journal, Bloomberg.com, ft.com, guggenheimpartners.com, zerohedge.com, ritholtz.com, markit.com, financialpost.com, Eurostat, Statistics Canada, Yahoo! Finance, stocksandnews.com, marketwatch.com, wantchinatimes.com, BBC, 361capital.com, pensionpartners.com, cnbc.com, FactSet; Figs 1-5 source W E Sherman & Co, LLC)
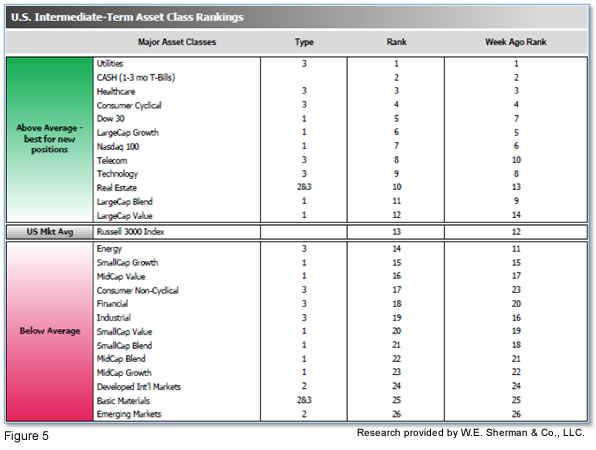
The ranking relationship (shown in Fig. 5) between the defensive SHUT sectors ("S"=Staples [a.k.a. consumer non-cyclical], "H"=Healthcare, "U"=Utilities and "T"=Telecom) and the offensive DIME sectors ("D"=Discretionary [a.k.a. Consumer Cyclical], "I"=Industrial, "M"=Materials, "E"=Energy), is one way to gauge institutional investor sentiment in the market. The average ranking of Defensive SHUT sectors rose to 7.25 from last week’s 9.25, while the average ranking of Offensive DIME sectors fell to 15.50 from last week’s 14.00. The Offensive DIME sectors and the Defensive SHUT sectors are essentially equally ranked. Note: these are “ranks”, not “scores”, so smaller numbers are higher ranks and larger numbers are lower ranks.

