![]()
Markets Up As Trade Tensions Ease
Submitted by The Blakeley Group, Inc. on May 11th, 2025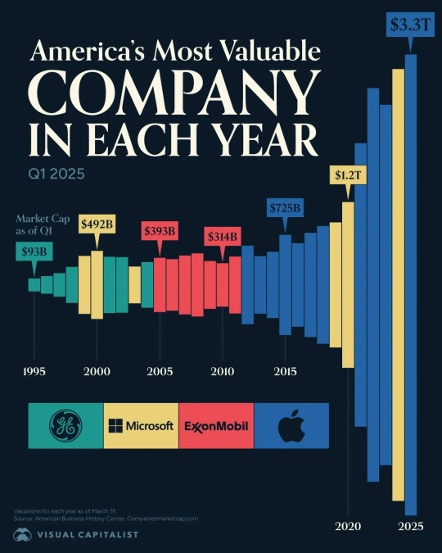
https://www.visualcapitalist.com/americas-most-valuable-company-in-each-year-1995-2025/
THIS WEEK IN THE MARKETS:
Markets continue up as trade tensions ease
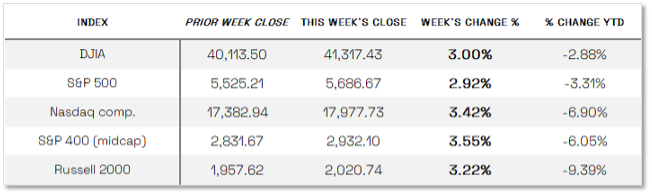
U.S. stocks ended the week on a high note, with the S&P 500 Index marking its second consecutive week of gains—the first such streak since January—and closing Friday with a nine-day winning streak. The Nasdaq Composite jumped 3.42%, buoyed by better-than-expected earnings from several large-cap tech companies, while small- and mid-cap indexes posted gains for the fourth straight week. Early optimism stemmed from easing trade tensions, as President Trump scaled back tariffs on cars and auto parts, and Commerce Secretary Howard Lutnick suggested a major trade agreement was nearing completion. As the week progressed, attention turned to earnings, with nearly 40% of the S&P 500’s market cap reporting first-quarter results, including four of the Magnificent Seven. Despite ongoing uncertainty around trade policy and limited forward guidance from companies, investor sentiment remained upbeat, with many confident that businesses could navigate slower economic growth and trade-related challenges.
Research provided by Sherman & Co., LLC.
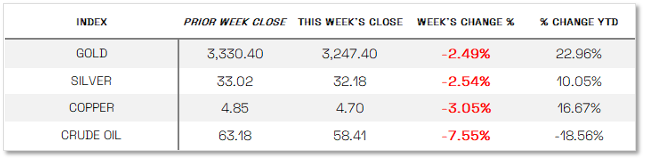
U.S. COMMODITIES / FUTURES OVERVIEW
Research provided by Sherman & Co., LLC.
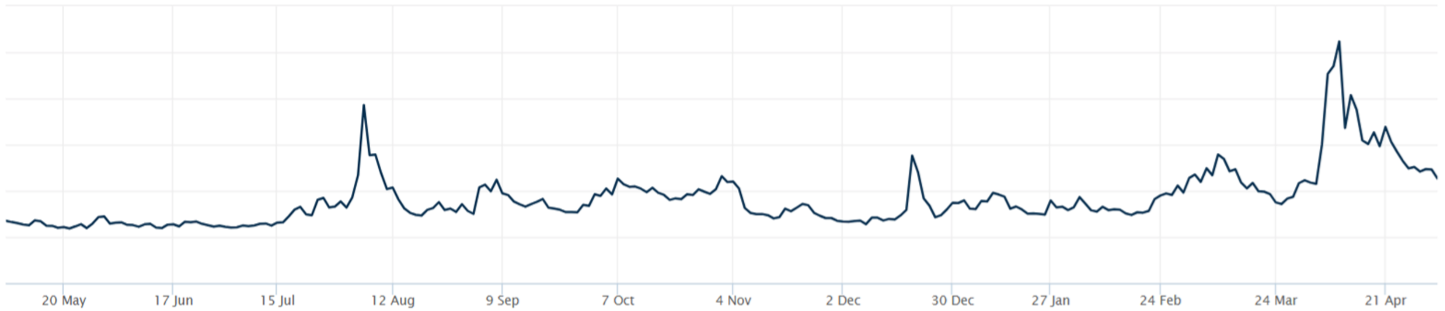
THE VOLATILITY INDEX for 2025 (VIX)
VIX closed at 22.68 this week, an 8.7% decrease vs last week’s close of 24.84
Research provided by Sherman & Co., LLC.
HOW VIX WORKS
The Volatility Index or VIX is the annualized implied volatility of a hypothetical S&P 500 stock option with 30 days to expiration. It can help investors estimate how much the S&P 500 Index will fluctuate in the next 30 days. While the VIX only measures the volatility of the S&P 500 Index, it has become a benchmark for the U.S. stock market.
The VIX is often referred to as the market’s “fear index or fear gauge”. The performance of the VIX is inversely related to the S&P 500 – when the price of the VIX goes up, the price of the S&P 500 usually goes down.
If the VIX is rising, demand for options is increasing, and therefore, becoming more expensive. If the VIX is falling, there's less demand, and options prices tend to fall. One thing to keep in mind is that current volatility cannot be known ahead of time. That's why it's a good idea to use the VIX in tandem with technical and fundamental analysis.
NOTE:
WE DO NOT USE CAPE AS AN OFFICIAL INPUT INTO OUR METHODS. HOWEVER, WE THINK HISTORY SERVES AS A GUIDE AND THAT IT’S GOOD TO KNOW WHERE WE ARE ON THE HISTORIC CONTINUUM. *SEE FOOTNOTES FOR MORE INFORMATION ON CAP.
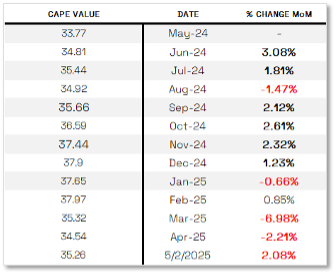
THE CAPE Ratio: 35.26
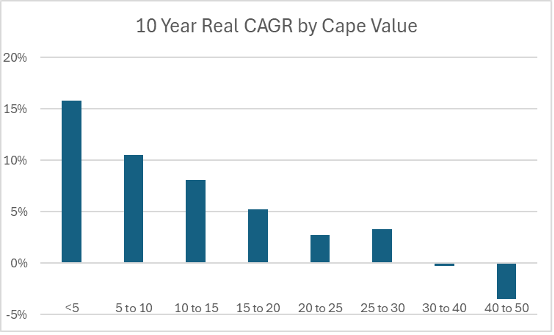
The 10-year CAGR of the Market with CAPE values between 30 and 40 is -0.3%
Research provided by Sherman & Co., LLC.
Research provided by Sherman & Co., LLC.
HOW CAPE WORKS
The cyclically adjusted price-to-earnings ratio (CAPE) can be used to smooth out the shorter-term earnings swings to get a longer-term assessment of market valuation. An extremely high CAPE ratio means that a company’s stock price is substantially higher than the company’s earnings would indicate and, therefore, overvalued. It is generally expected that the market will eventually correct the company’s stock price by pushing it down to its true value.
In the past, the CAPE ratio has proved its importance in identifying potential bubbles and market crashes. The historical average of the ratio for the S&P 500 Index is between 15-16, while the highest levels of the ratio have exceeded 30. The record-high levels occurred three times in the history of the U.S. financial markets. The first was in 1929 before the Wall Street crash that signaled the start of the Great Depression. The second was in the late 1990s before the Dotcom Crash, and the third came in 2007 before the 2007-2008 Financial Crisis.
THIS WEEK’S ECONOMIC NEWS For USA
Mixed Economic Data
This week’s economic data presented a mixed view of the U.S. economy, with job openings declining but hiring remaining resilient. The Bureau of Labor Statistics reported that job openings fell to 7.2 million in March—the lowest since September—indicating potential softening in labor demand amid economic uncertainty. ADP’s report showed private payrolls increased by just 62,000 in April, a sharp drop from March’s revised 147,000. However, Friday’s BLS payrolls report offered a more optimistic signal, with 177,000 jobs added in April—well above expectations—while the unemployment rate held steady at 4.2% and wages rose modestly. Stocks responded positively to the upbeat labor data. Meanwhile, the Bureau of Economic Analysis announced that GDP contracted at an annual rate of 0.3% in the first quarter, marking the first decline since 2022, driven by increased imports, slower consumer spending, and a drop in government outlays—likely influenced by companies accelerating purchases ahead of new tariffs. On a brighter note, the PCE Price Index was flat in March and consumer spending rose 0.7%, suggesting economic resilience and easing inflation pressures, though the full impact of recent tariffs has yet to be reflected.
INTERNATIONAL MARKETS
Research provided by Sherman & Co., LLC.
Europe
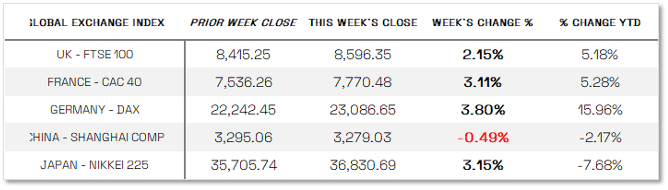
European stocks climbed as easing tariff concerns lifted investor sentiment, with the pan-European STOXX Europe 600 Index gaining 3.44% in local currency terms. Major indexes also advanced, including Germany’s DAX, Italy’s FTSE, France’s CAC 40, and the UK’s FTSE 100 Supporting the rally, eurozone GDP growth accelerated to 0.4% in the first quarter—double the previous quarter’s pace and above economists’ expectations. Spain and Italy exceeded forecasts with growth of 0.6% and 0.3%, respectively, while Germany and France returned to modest expansion; Ireland posted a standout 3.2% increase, though its data can be skewed by multinational activity. However, inflation remained stubborn, with headline CPI holding at 2.2% in April and core inflation rising to 2.7% from 2.4%. Despite the improved economic performance, business and consumer sentiment weakened following the U.S. announcement of reciprocal tariffs in early April. The European Commission’s economic confidence indicator fell to 93.6, its lowest since December, and consumer sentiment remained subdued at -16.7, reflecting growing pessimism and caution in household spending.
Japan
Japanese stock markets rose over the week, with the Nikkei 225 gaining 3.15%, supported by signs of easing global trade tensions, while the yen weakened to around the mid-143 range against the U.S. dollar and the 10-year Japanese government bond yield climbed to 1.34% from 1.29%. A stronger-than-expected Tokyo-area inflation reading, with core CPI rising 3.4% year over year in April, bolstered the case for further Bank of Japan (BoJ) rate hikes, although BoJ Governor Kazuo Ueda emphasized that monetary policy normalization would proceed cautiously amid uncertainties surrounding the economic impact of U.S. tariffs. Inflation acceleration was mainly driven by food price increases and cuts to government energy subsidies. Meanwhile, Japan’s government announced emergency economic relief measures, including support for corporate financing and efforts to stimulate consumption, to counter the effects of higher U.S. tariffs, as bilateral trade talks continued without Japan yet securing exemptions; Prime Minister Shigeru Ishiba warned that key domestic industries like automobiles and steel could face significant challenges under the current tariff regime.
China
China’s Politburo announced plans to “fully prepare” emergency responses to external shocks and unveiled intentions to develop new monetary tools and policy financing instruments aimed at boosting technology, consumption, and trade, according to Bloomberg and state media reports. The Politburo, led by President Xi Jinping, signaled a measured and patient approach to supporting the economy amid the trade war with the U.S., even as analysts expect the effects of the Trump administration’s April tariff hikes—which raised total tariffs on most Chinese goods to 145%—to soon materialize. Nevertheless, China’s stronger-than-expected first-quarter growth and the early March stimulus measures have given Beijing more flexibility in timing additional economic support.
Sources:
All index and returns data from Norgate Data and Commodity Systems Incorporated and Wall Street Journal
News from Reuters, Barron’s, Wall St. Journal, Bloomberg.com, ft.com, guggenheimpartners.com, zerohedge.com, ritholtz.com, markit.com, financialpost.com, Eurostat, Statistics Canada, Yahoo! Finance, stocksandnews.com, marketwatch.com, visualcapitalist.com, wantchinatimes.com, BBC, 361capital.com, pensionpartners.com, cnbc.com, FactSet, Morningstar/Ibbotson Associates, Corporate Finance Institute.
Commentary from T Rowe Price Global markets weekly update — https://www.troweprice.com/personal-investing/resources/insights/global-...