MAR 2022 Energy Production
Submitted by The Blakeley Group, Inc. on March 17th, 2022The very big picture (a historical perspective):
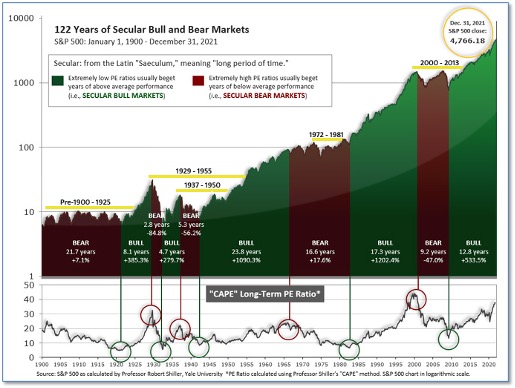
The long-term valuation of the market is commonly measured by the Cyclically Adjusted Price to Earnings ratio, or “CAPE”, which smooths-out shorter-term earnings swings in order to get a longer-term assessment of market valuation. A CAPE level of 30 is considered to be the upper end of the normal range, and the level at which further PE-ratio expansion comes to a halt (meaning that further increases in market prices only occur as a general response to earnings increases, instead of rising “just because”). The market is now above at that level.
Of course, a “mania” could come along and drive prices higher - much higher, even - and for some years to come. Manias occur when valuation no longer seems to matter, and caution is thrown completely to the wind - as buyers rush in to buy first, and ask questions later. Two manias in the last century - the “Roaring Twenties” of the 1920s, and the “Tech Bubble” of the late 1990s - show that the sky is the limit when common sense is overcome by a blind desire to buy. But, of course, the piper must be paid, and the following decade or two were spent in Secular Bear Markets, giving most or all of the mania-gains back.
The Very Big Picture: 120 Years of Secular Bulls and Bears

Figure 1
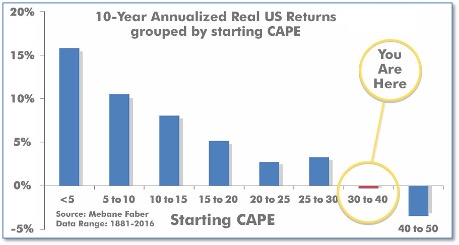
See Fig. 1 for the 100-year view of Secular Bulls and Bears. The CAPE is now at 35.43, down from the prior week’s 35.89. Since 1881, the average annual return for all ten-year periods that began with a CAPE in this range has been negative (see Fig. 2).
The Very Big Picture: Historical CAPE Values
Current reading: 35.43

Figure 2
Note: We do not use CAPE as an official input into our methods. However, if history is any guide - and history is typically ‘some’ kind of guide - it’s always good to simply know where we are on the historic continuum, where that may lead, and what sort of expectations one may wish to hold in order to craft an investment strategy that works in any market ‘season’ … whether the current one, or one that may be ‘coming soon’!
The big picture:
As a reading of our Bull-Bear Indicator for U.S. Equities (comparative measurements over a rolling one-year timeframe), we entered a new Cyclical Bear on March 4, 2022.
The complete picture:
Counting-up of the number of all our indicators that are ‘Up’ for U.S. Equities (see Fig. 3), the current tally is that two of four are Positive, representing a multitude of timeframes (two that can be solely days/weeks, or months+ at a time; another, a quarter at a time; and lastly, the {typically} years-long reading, that being the Cyclical Bull or Bear status).

In the markets:
U.S. Markets: U.S. stocks ended lower after a volatile week, as investors continued to assess the crisis in Ukraine. The Dow Jones Industrial Average shed 444 points to close at 33,615, a decline of -1.3%. The technology-heavy NASDAQ Composite fared the worst with a -2.8% decline. By market cap, the large cap S&P 500 retreated -1.3%, while the mid cap S&P 400 pulled back -1.7% and the small cap Russell 2000 ended the week down -2.0%.
International Markets: The vast majority of international markets finished the week in the red. Canada’s TSX was the lone major market to finish up last week, adding 1.4%, driven higher by energy and commodity stocks. However, across the Atlantic the United Kingdom’s FTSE 100 declined -6.7%. On Europe’s mainland, France’s CAC 40 and Germany’s DAX plunged -10.2% and -10.1%, respectively. In Asia, China’s Shanghai Composite ticked down -0.1%. Japan’s Nikkei ended down -1.9%. As grouped by Morgan Stanley Capital International, developed markets finished the week down -7.5%. Emerging markets declined -5.8%.
Commodities: Major commodities soared last week as the crisis in Ukraine and inflation continued to roil markets. West Texas Intermediate crude oil surged 26.3% last week closing at $115.68 per barrel. Precious metals also gained with Gold rising 4.2% to $1966.60 per ounce, and Silver adding 7.4% to $25.79. The industrial metal copper rallied 10.1%.
February Summary: In the month of February, the Dow and Nasdaq declined -3.5% and -3.4%, respectively. By market cap, large caps ended the month down -3.1%, while mid caps and small caps each finished the month up 1.0%. In international markets, Canada ticked up a bare 0.1%, while the United Kingdom ticked down -0.1%. France and Germany, however, retreated -6.5% and -4.9%, respectively. China gained +3%, but Japan’s Nikkei finished the month down -1.8%. Emerging markets declined -4.3% in February, and developed markets fell -3.4%. February saw Gold and Silver rise 5.8% and 8.8%, respectively, while Oil gained 8.6%. Copper finished the month up 3.0%
U.S. Economic News: The U.S. gained over half a million jobs in February as every major industry was hiring in the new year. The Bureau of Labor Statistics reported the U.S. added 678,000 jobs in February. The increase in hiring lowered the unemployment rate to 3.8% from 4%. Economists had expected just 400,000 new jobs to be created. About a quarter of the new jobs created in February were in leisure and hospitality, the industries most affected when coronavirus cases were high. Restaurants added 124,000 new jobs last month and hotels hired 28,000 people. Hiring also rose strongly at white-collar professional jobs (95,000), health care (64,000), construction (60,000) and transportation and warehousing (48,000). No industry reported a decline in employment, although the “Information” sector registered zero new jobs. The percentage of people in the labor force rose a tick to 62.3%, though it’s still well below the peak before the pandemic. The economy would have roughly 3 million additional workers if the so-called participation rate in the labor market was the same now as it was prior to the pandemic.
The number of Americans filing first-time unemployment claims fell to a two-month low last week as labor shortages continued. The Labor Department reported initial claims for unemployment benefits fell by 18,000 to 215,000 last week. Economists had expected new claims to total 225,000. The economy appears to have regained some momentum after waning at the end of 2021. Coronavirus cases have declined, governments lifted restrictions and businesses are trying to deliver more goods and services. The big holdups remain the lingering shortages of materials and labor. New jobless claims fell the most in Michigan, California, Florida, Illinois and Ohio. The only state to show a sizable increase was Massachusetts. Meanwhile, continuing claims, which counts the number of people already collecting benefits, edged up by 2,000 to 1.48 million. That number has returned to pre-coronavirus levels.
Business activity in the ‘Windy City’ slowed in February, according to the Institute for Supply Management (ISM). The Chicago Business Barometer fell last month to an 18-month low of 56.3, as companies continued to struggle with a shortage of labor and materials. The decline was worse than expected. Economists had expected the index to drop just 1.8 points to 63.4. While technically still in expansion (over 50), the index is sharply lower compared to last summer. In the report, new orders and production both declined in February and employment fell to the lowest level since October 2020. However, there was one bit of good news. The prices that companies paid for supplies slid to an 11-month low. While prices, and overall inflation, remain high, some businesses reported they were leveling off.
Across the entire country, ISM’s Manufacturing Index rose one point to 58.6 in February—a sign the economy rebounded somewhat following the outbreak of the Omicron-variant of the coronavirus. The increase in the manufacturing index was the first in four months. The reading surpassed economists’ expectations of a reading of 58. In the report, the index of new orders rose 3.8 points to 61.7 after falling at the start of 2022 to the lowest level in a year and a half. Production also edged up. Yet a gauge of employment dipped to 52.9 to mark a five-month low. The backlog of orders also soared to the second highest level on record, a sign that companies can’t produce enough to meet high demand. A lack of labor and ongoing shortages of key supplies are holding back production and contributing to the highest U.S. inflation in 40 years. Timothy Fiore, chairman of the survey, said businesses can cope with labor and supply shortages so long as they have plenty of customers pestering them with orders. “As long as demand is strong, everything else we can deal with,” he said.
Speaking to the House Financial Services Committee, Federal Reserve Chairman Jerome Powell stated the central bank intends to raise its policy interest rate by a quarter-percentage point following the end of its two-day meeting on March 16. “With inflation well above 2% and a strong labor market, we expect it will be appropriate to raise the target range for the federal funds rate at our meeting later this month,” Powell said. Most economists had penciled in a quarter-point at the March meeting. Speculation of a half-percentage point hike has waned in the aftermath of Russia’s invasion of Ukraine. Analysts expect the Fed to continue to raise rates throughout the year. Powell said he wanted to proceed “carefully,” which is likely a signal of further quarter-point moves. But the Fed chairman said larger rate hikes were on the table if inflation doesn’t subside. “To the extent inflation comes in higher or is more persistently high…then we would be prepared to move more aggressively by raising the federal funds rate by more than 25 basis points at a meeting or meetings,” Powell said.
Inflation appears to be showing no signs of slowing down, according to the Federal Reserve’s ‘Beige Book’—a collection of anecdotal reports of current economic conditions from each of its member banks. In the survey, “Firms reported they expect additional price increases over the next several months as they continue to pass on input cost increases.” Consumer spending was generally weaker as a result over the period, but prices charges to customers “increased at a robust pace across the nation.” In addition, the survey found that economic activity expanded at a “modest to moderate pace” over the first two months of the year. All 12 of the Fed’s districts reported that supply chain issues and low inventories continued to restrain growth, especially in the construction sector. There were “scattered signs” of improving labor supply.
International Economic News: Canada’s economy started the new year on strong footing, despite the Omicron coronavirus variant and protests that shut down key border crossings. Statistics Canada reported Canada’s economy grew 6.7% in the final quarter of last year, beating analyst expectations of 6.5%. StatCan also noted preliminary figures for January show GDP growth of 0.2%. With January's gain, economic activity is now 0.6% above pre-pandemic levels, the agency said. The strong fourth quarter print came in above the Bank of Canada's own January forecast of a fourth quarter gain of 5.8%. Given the strong figures, the Bank of Canada hiked its key interest rate 25 basis points to 0.5% in an effort to “take some steam” out of the economy and tamp down on surging inflation.
Across the Atlantic, the United Kingdom introduced new sanctions against Russia, including banning Russian ships from UK ports and additional economic measures. The new measures prohibit UK individuals and entities from providing financial services to the Central Bank of the Russian Federation, as well as the Ministry of Finance and National Wealth Fund. Foreign Secretary Liz Truss announced the measures stating the UK, “stands with Ukraine, its people and its democracy, and will continue to support them diplomatically, economically, politically and defensively.”
On Europe’s mainland, on France Info radio French Finance Minister Bruno Le Maire declared France was waging an “all-out economic and financial war" against Russia to bring down its economy as punishment for invading Ukraine. Le Maire's initial remarks drew an angry rebuke from Russia's former president and prime minister, Dmitry Medvedev, who is now the deputy Chair of the Security Council of the Russian Federation. "Watch your tongue, gentlemen! And don’t forget that in human history, economic wars quite often turned into real ones," Medvedev tweeted. Le Maire later told French news agency AFP he had “misspoken” and that the term "war" was not compatible with France's efforts to de-escalate tensions surrounding the Ukraine conflict.
In a previously unthinkable step for German Chancellor Olaf Scholz’s government, Germany announced plans to slowly move away from Russian gas dependence. "We will change course to overcome our import dependence," Scholz said at the Bundestag, or lower-house of parliament. The decision represents a massive and expensive reversal for the government which had depended on Russia to secure its energy needs over the past two decades. Finance Minister Christian Lindner said policymakers still needed to "prepare for a scenario" where Russia "stops gas deliveries". Initially, Germany hopes to substitute Russian supplies with larger deliveries of liquefied natural gas (LNG), which can be imported by sea from producers such as the United States or Qatar. But Germany lacks the infrastructure to receive overseas gas, with no LNG terminals along its coast where tankers can dock. Their absence means it will have to import supplies through one of the European Union's 21 other terminals, a costly solution at a time when energy prices are soaring.
As Russia’s economy continues to bear the brunt of western sanctions, China has emerged as the key player with the potential to lessen its partner’s economic pain. Beijing and Moscow have forged close ties in recent years, often aligning to oppose what they view as interference by the US and its allies. Earlier this month, Putin held talks with Chinese President Xi Jinping in Beijing, where the two leaders declared that friendship between their countries had “no limits” and no “forbidden” areas of cooperation. The meeting resulted in a raft of trade deals, including the signing of a 30-year contract for Russia to supply gas to China via a new pipeline. Furthermore, this week Chinese customs authorities announced the lifting of import restrictions on Russian wheat. Gary Ng, an Asia economist at Natixis, said the current sanctions regime gives China considerable room to continue legitimate trade with Russia. “With China’s support, the pressure on Russia will definitely be less, especially for financial linkages,” Ng said.
A relaxation of COVID-19 restrictions prompted a boost in consumer spending and a rebound in Japan’s economy at the end of last year. Japan’s Gross Domestic Product (GDP) rose an annualized 5.4% in the fourth quarter, according to figures from Japan’s Cabinet Office. Economists had expected a 5.8% rise. But analysts warned the economy probably lost steam after December when the Omicron-variant spread and oil prices began to rise. Consumer spending, which makes up more than half of Japan’s GDP, increased 2.7% from the previous quarter. For the whole of 2021, Japan’s economy rose 1.7%.
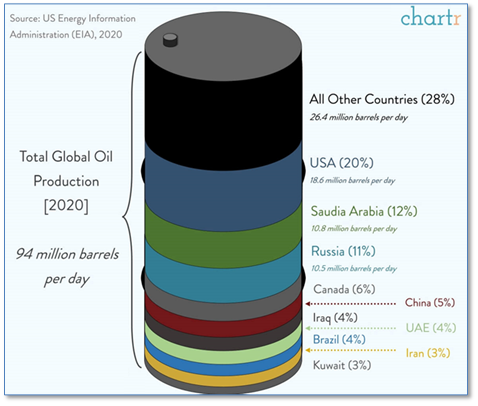
Finally: It is well known that Russia is one of the world’s largest producers of energy, both natural gas and oil. So as gas prices continue to hit new highs across the country, just how much of the world’s oil does Russia produce? Data from the U.S. Energy Information Administration shows that Russia is currently third in the world in daily production of Brent crude oil, with 11% of the total. The U.S.A. leads with 20% and Saudi Arabia is second at 12%. Interestingly enough, Russia’s “Urals grade” oil is now trading at an $18 per barrel discount to Brent as buyers are bypassing Russian oil in favor of other exporters. (Data: EIA, Chart: chartr.co)

(Sources: All index- and returns-data from Yahoo Finance; news from Reuters, Barron’s, Wall St. Journal, Bloomberg.com, ft.com, guggenheimpartners.com, zerohedge.com, ritholtz.com, markit.com, financialpost.com, Eurostat, Statistics Canada, Yahoo! Finance, stocksandnews.com, marketwatch.com, wantchinatimes.com, BBC, 361capital.com, pensionpartners.com, cnbc.com, FactSet.)

