Manufacturing is Up
Submitted by The Blakeley Group, Inc. on June 25th, 2024

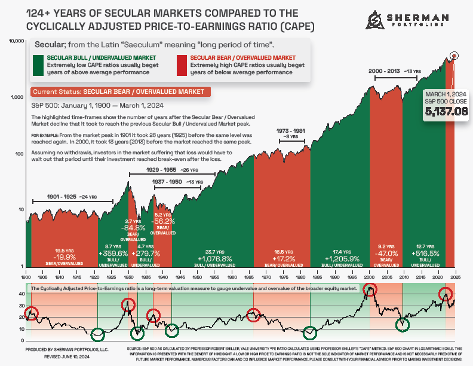
THE BIG PICTURE // YEARS-LONG TIMEFRAME
The ‘big picture’ is the (typically) years-long timeframe, the same timeframe in which Cyclical Bulls and Bears operate.
The Sherman Portfolios DELTA-V Indicator measuring the Bull/Bear cycle finished the week in BULL status at 76.97, up 1.58% from the prior week’s 75.33. It has signaled Bull since April 21, 2023.
The Sherman Portfolios DELTA-V Bond Indicator measuring the Bull/Bear cycle finished the week in BULL status at 62.30, up 2.40% from the prior week’s 60.84. It has signaled Bull since December 15, 2023.
SHORTER TERM PICTURE // QUARTERLY TIMEFRAME
INDICATOR POSITIONS
GALACTIC SHIELD — POSITIVE entering April 2024 (Q2)
indicating positive prospects for equities in the second quarter of 2024. This indicator is based on the combination of U.S. and International Equities trend statuses at the start of each quarter.
STARFLUX— POSITIVE since Nov 16, 2023
and ended the week at 6.85 (Down 2.56% last week) This short-term indicator measures U.S. Equities.
STARPATH — POSITIVE since November 21, 2023.
This indicator measures the interplay on dual timeframes of our Type 1s + the Russell 3000 + our four most ‘pro-cyclical’ Type 3s, vs. Cash.
THE COMPLETE PICTURE // READING THE INDICATORS
FOUR INDICATORS ACROSS THREE TIMEFRAMES
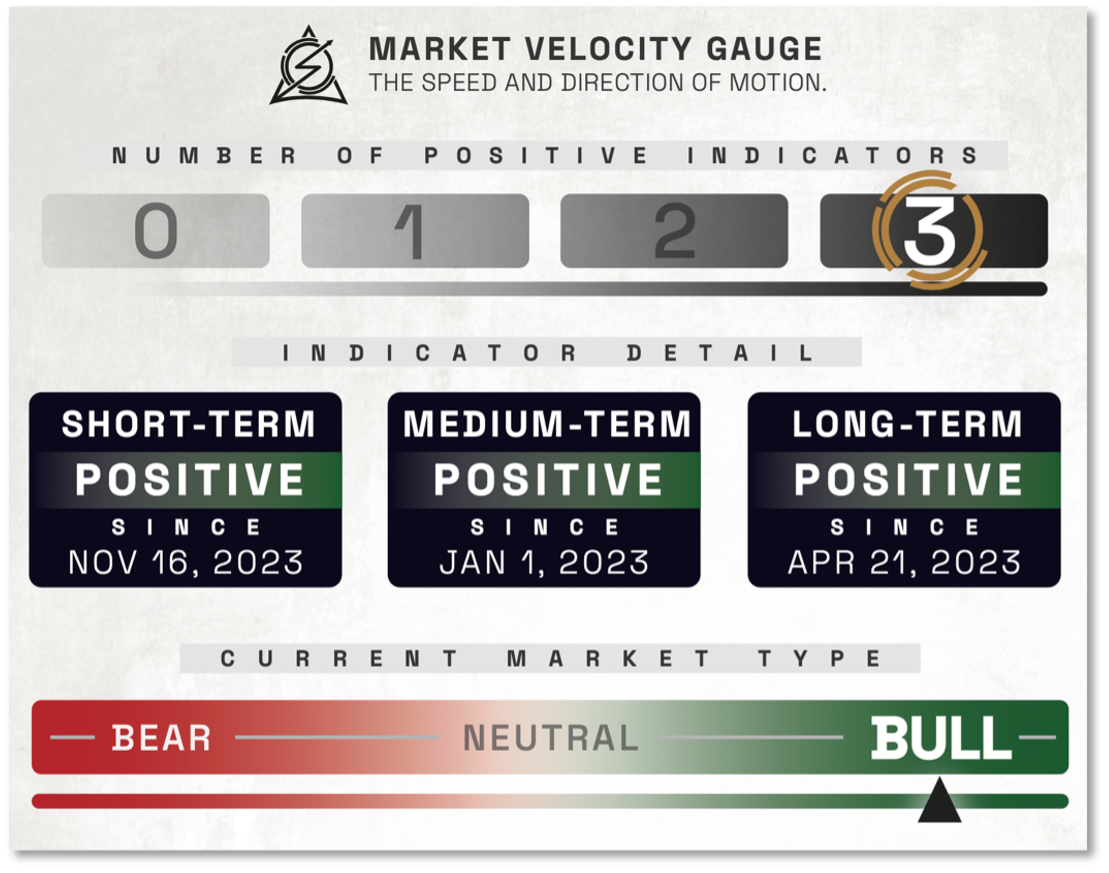
- DELTA-V — POSITIVE since
- GALACTIC SHIELD — POSITIVE since January 1, 2024
- STARFLUX— POSITIVE since Nov 16, 2023
- STARPATH — POSITIVE since November 21, 2023
When all four of the Sherman Portfolios indicators are in a POSITIVE status, we read the market as being in a CYCLICAL BULL MARKET
THIS WEEK IN THE MARKETS
U.S. MARKET INDEXES OVERVIEW
Equities up as gains broaden
Stocks recorded modest gains over the shortened trading week, due to the observation of the Juneteenth holiday, which helped propel the S&P 500 Index to new all-time highs. Signs of market broadening and rotation emerged, with value stocks outperforming growth shares and most major benchmarks surpassing the technology-heavy Nasdaq Composite. The week concluded with a triple-witching day, where approximately USD 5.5 trillion in options related to indexes, individual stocks, and exchange-traded funds expired. Additionally, the Commerce Department reported a slight 0.1% increase in May retail sales following a revised 0.2% decline in April, indicating cautious consumer behavior amid easing labor demand and dwindling savings. Notably, sales at bars, restaurants, and grocery stores fell by 0.4%, reflecting less discretionary spending and potential price cuts in certain food categories, as retail sales data are not adjusted for inflation.

DOW & TECH
> THE DOW JONES INDUSTRIAL AVERAGE (DJIA) is the oldest continuing U.S. market index with over 100 years of history and is made up of 30 highly reputable “blue-chip” U.S. stocks (e.g. Coca-Cola Co., Microsoft).
The Dow showed a gain this week, ending the week of June 16th down 1.45% to end at 39,150.33 vs the prior week of 38,589.16
> THE NASDAQ COMPOSITE INDEX tracks most of the stocks listed on the Nasdaq Stock Market - the second-largest stock exchange in the world. Over half of all stocks on the NASDAQ are tech stocks.
The tech-driven Nasdaq showed no change of note this week. NASDAQ was up 0.00% by closing this week, ending at 17,689.36 vs. the prior week of 17,688.88.
SMALL, MEDIUM, & LARGE CAP
> THE S&P 500 LARGE-CAP INDEX is a market-capitalization-weighted index of 500 leading publicly traded companies in the U.S. The S&P 500 is regarded as one of the best gauges of prominent American equities' performance, and by extension, that of the stock market overall.
The S&P 500 was in the black this week. It was up 0.61%, closing at 5464.62 compared to last week’s 5431.60.
> THE S&P 400 MID-CAP INDEX is the benchmark index made up of 400 stocks that broadly represent companies with midrange market capitalization between $3.6 billion and $13.1 billion. It is used by investors as a gauge for market performance and directional trends in U.S. stocks.
The S&P 400 mid-cap showed the highest gains of these three this week, up 1,26%. It went from last week’s close of 2894.31 to 2931.86.
> THE RUSSELL 2000 (RUT) SMALL-CAP INDEX measures the performance of the 2,000 smaller companies included in the Russell 3000 Index. The Russell 2000 is managed by London's FTSE Russell Group and is widely regarded as a leading indicator of the U.S. economy because of its focus on smaller companies that focus on the U.S. market.
The Russel 2000 joined the other funds in the black. It was up 0.79% for the week, closing at 2022.03 compared to last week’s 2006.16.
U.S. COMMODITIES / FUTURES OVERVIEW
Commodities continued the downtrend, showing poor performance across the board.

THE VOLATILIY INDEX (VIX)
VIX closed at 13.20 this week, a 4.27% Increase over last week’s close of 12.66.

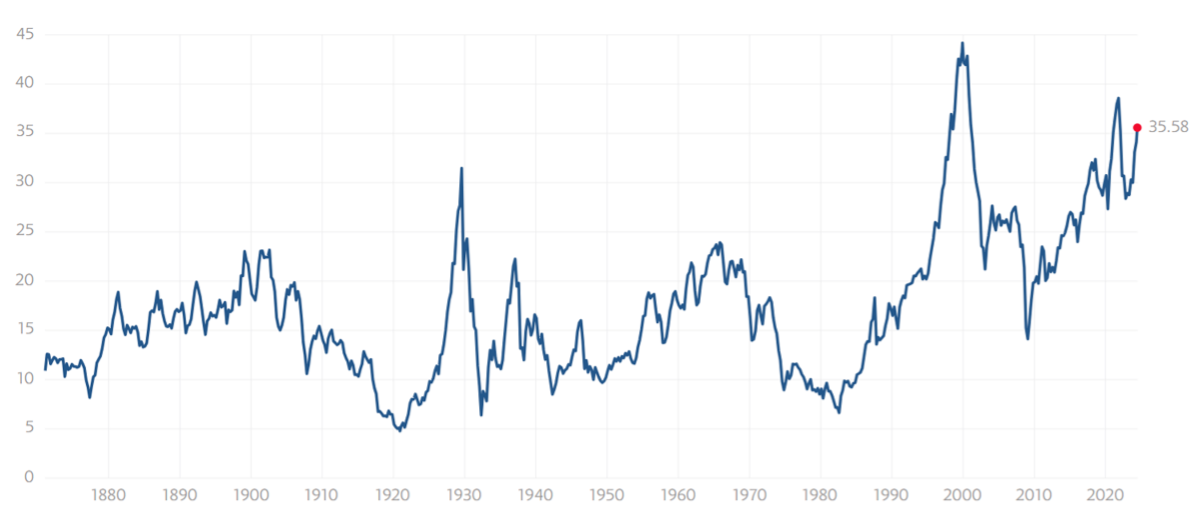
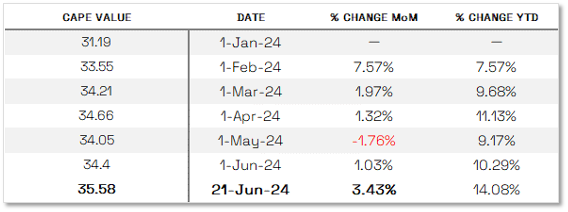
NOTE: WE DO NOT USE CAPE AS AN OFFICIAL INPUT INTO OUR METHODS. HOWEVER, WE THINK HISTORY SERVES AS A GUIDE AND THAT IT’S GOOD TO KNOW WHERE WE ARE ON THE HISTORIC CONTINUUM. *SEE FOOTNOTES FOR MORE INFORMATION ON CAPE
THE CAPE Ratio (2024)
35.58 – up 3.43% this month.


THIS WEEK’S ECONOMIC NEWS
FOR THE U.S. MARKET
Manufacturing up, despite consumer spending
Manufacturing showed notable strength, with the Federal Reserve reporting a 0.9% increase in industrial production for May, the fastest pace in nearly a year, and factory capacity utilization rising to 78.7%, the highest since last November. This was a sharp contrast to weaker consumer spending, as suggested by retail sales data. Later in the week, S&P Global announced a rise in its composite index of business activity to 54.6 in June, the highest in over two years, indicating economic expansion. The services sector saw robust growth, with payrolls increasing at the best pace in five months and selling price pressures easing, though higher wage bills continued to pressure operating margins.
Fixed income market up, despite high issuance
Lackluster retail sales data initially pushed longer-term Treasury yields lower, but stronger S&P Global readings on Friday reversed this trend, resulting in a modest increase in yields by the end of the week. Tax-exempt municipal bond yields remained relatively steady, with light secondary trading volumes despite heavy issuance. The investment-grade corporate bond market also saw heavy issuance early in the week, surpassing expectations by Tuesday. Improved investor sentiment and equity gains bolstered high yield bonds, with economic slowdown signs and encouraging comments from Federal Reserve officials about a potential rate cut later this year supporting the performance of risk assets overall.
INTERNATIONAL MARKETS
LOOKING AT THE GLOBAL PICTURE

Europe
In Europe, the STOXX Europe 600 Index rose by 0.79% in local currency terms, rebounding as concerns over political uncertainty eased and expectations grew for monetary policy easing. Major stock indexes in Germany, France, Italy, and the UK also posted gains: Germany's DAX increased by 0.90%, France's CAC 40 rose by 1.67%, Italy's FTSE MIB climbed by 1.97%, and the UK's FTSE 100 added 1.12%. The Bank of England maintained its key interest rate at 5.25%, with some policymakers indicating a balanced decision that could pave the way for potential rate cuts later in the year. Inflation in the UK eased to the central bank's 2% target in May, down from 2.3% in April, though services inflation remained higher than expected at 5.7%. Meanwhile, the Swiss National Bank reduced rates for the second consecutive meeting to 1.25%, citing decreased inflationary pressures, while Norway's Norges Bank held its rate steady at 4.5%, anticipating no changes for the remainder of the year. Eurozone business activity faced unexpected challenges as private sector activity slowed in June, with both services and manufacturing sectors showing signs of contraction, as indicated by the HCOB Composite PMI falling to 50.8 from 52.2 in May.
Japan
Japan's stock markets experienced declines as the Nikkei 225 Index fell by 0.6% and the broader TOPIX Index dropped 0.8% during the week, influenced by uncertainty surrounding the Bank of Japan's monetary policy direction. The yield on 10-year Japanese government bonds rose to 0.97% from 0.93% the previous week, reflecting investor reactions to accelerated inflation in May, which reached 2.5% year-on-year, slightly below expectations. BoJ Governor Kazuo Ueda suggested the possibility of a July rate hike depending on forthcoming data, separate from the central bank's planned tapering of JGB purchases in the same month. Meanwhile, the yen weakened against the USD, trading around JPY 158.8, nearing historic lows amid U.S.-Japan interest rate differentials. Despite Japanese authorities intervening in currency markets earlier in the year, the yen's depreciation trend continued. Economic indicators showed a halt in private sector business activity expansion in June, with the composite PMI dropping to 50.0 due to subdued services activity attributed to labor shortages, though manufacturing conditions saw slight improvement for a second consecutive month.
China
Chinese stocks faced a retreat amidst mixed economic indicators that tempered investor confidence. The Shanghai Composite Index declined by 1.14%, while the CSI 300 retreated 1.3%. Conversely, Hong Kong's Hang Seng Index edged up 0.48%. Industrial production in China grew by 5.6% year-on-year in May, below expectations and slower than April's 6.7% growth, while fixed asset investment expanded by 4% year-to-date in May, showing a slight deceleration from earlier in the year, notably due to declining real estate investment. Retail sales, however, exceeded expectations with a 3.7% increase year-on-year in May, surpassing April's 2.3% growth. The urban unemployment rate remained steady at 5%. The People's Bank of China injected RMB 182 billion into the banking system through its medium-term lending facility, maintaining the lending rate at 2.5%. Despite RMB 237 billion in expiring loans resulting in a net withdrawal of RMB 55 billion, the central bank offset this with an additional RMB 4 billion injection in short-term loans. Chinese banks left their loan prime rates unchanged at 3.45% and 3.95% for one-year and five-year loans, respectively, in line with expectations.
Other Key Markets
Hungary
The National Bank of Hungary (NBH) convened its regular meeting on Tuesday and opted to lower its main policy rate, the base rate, from 7.25% to 7.00%. Additionally, the NBH reduced the overnight collateralized lending rate, part of the interest rate corridor around the base rate, from 8.25% to 8.00%, and lowered the overnight deposit rate from 6.25% to 6.00%. These adjustments, amounting to 25 basis points each, aligned with market expectations. According to the NBH's statement following the meeting, policymakers acknowledged a notable rise in real wages and improving consumer confidence, contributing to increased household consumption in the first quarter. They also noted a general decline in investment, which restrained overall economic growth potential, and observed a easing of labor market tightness in recent quarters. Despite an improved short-term inflation outlook, attributed to better-than-expected economic data and lower oil prices, policymakers anticipate core inflation to stabilize in the second quarter and rise to close to 5% by year-end, contrasting with their March forecast. The NBH highlighted factors such as the country's economic recovery, robust foreign exchange reserves, improved current account balance, and a cautious monetary policy stance as enhancing Hungary's risk profile. However, mindful of volatile financial markets, geopolitical tensions, and persistent inflation risks, policymakers emphasized a prudent and patient approach to future monetary policy decisions, citing ongoing assessment of macroeconomic data and risk environment developments.

