JUNE 2022 Gouging
Submitted by The Blakeley Group, Inc. on June 9th, 2022The very big picture (a historical perspective):
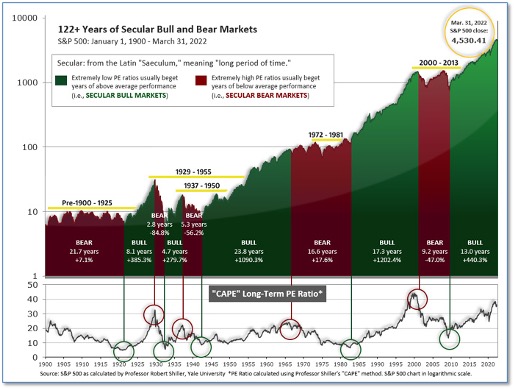
The long-term valuation of the market is commonly measured by the Cyclically Adjusted Price to Earnings ratio, or “CAPE”, which smooths-out shorter-term earnings swings in order to get a longer-term assessment of market valuation. A CAPE level of 30 is considered to be the upper end of the normal range, and the level at which further PE-ratio expansion comes to a halt (meaning that further increases in market prices only occur as a general response to earnings increases, instead of rising “just because”). The market is now above that level.
Of course, a “mania” could come along and drive prices higher - much higher, even - and for some years to come. Manias occur when valuation no longer seems to matter, and caution is thrown completely to the wind - as buyers rush in to buy first, and ask questions later. Two manias in the last century - the “Roaring Twenties” of the 1920s, and the “Tech Bubble” of the late 1990s - show that the sky is the limit when common sense is overcome by a blind desire to buy. But, of course, the piper must be paid, and the following decade or two were spent in Secular Bear Markets, giving most or all of the mania-gains back.
The Very Big Picture: 120 Years of Secular Bulls and Bears

Figure 1
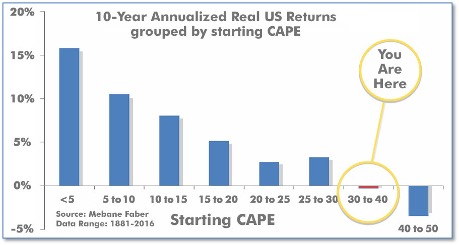
See Fig. 1 for the 100-year view of Secular Bulls and Bears. The CAPE is now at 32.13, up from the prior week’s 31.68. Since 1881, the average annual return for all ten-year periods that began with a CAPE in this range has been negative (see Fig. 2).
Note: We do not use CAPE as an official input into our methods. However, if history is any guide - and history is typically ‘some’ kind of guide - it’s always good to simply know where we are on the historic continuum, where that may lead, and what sort of expectations one may wish to hold in order to craft an investment strategy that works in any market ‘season’ … whether the current one, or one that may be ‘coming soon’!
The Very Big Picture: Historical CAPE Values
Current reading: 32.13

The big picture:
As a reading of our Bull-Bear Indicator for U.S. Equities (comparative measurements over a rolling one-year timeframe), we entered a new Cyclical Bear on March 4, 2022.
The complete picture:
Counting-up of the number of all our indicators that are ‘Up’ for U.S. Equities (see Fig. 3), the current tally is that two of the four are Positive, representing a multitude of timeframes (two that can be solely days/weeks, or months+ at a time; another, a quarter at a time; and lastly, the {typically} years-long reading, that being the Cyclical Bull or Bear status).
The Current ‘Complete Picture’: The Sum of Positive Indicators.

In the markets:
U.S. Markets: U.S. stocks surrendered a portion of the previous week’s strong gains as investors continued to question whether the Federal Reserve would be able to rein in inflation without causing a recession. All of the major equity benchmarks finished the week to the downside. The Dow Jones Industrial Average shed 313 points, finishing the week at 32,900, down -0.9%. The technology-heavy NASDAQ Composite shed -1% and closed at 12,013. By market cap, the large cap S&P 500 fared the worst, ending down -1.2%, while the mid cap S&P 400 retreated ‑0.7% and the small cap Russell 2000 finished down -0.3%.
International Markets: International markets were mixed for the week. Canada’s TSX ticked up 0.2% last week, while the United Kingdom’s FTSE 100 shed -0.7%. On Europe’s mainland, France’s CAC 40 pulled back -0.5% and Germany’s DAX finished essentially flat. In Asia, China’s Shanghai Composite rose 2.1% and Japan’s Nikkei rallied 3.7%. As grouped by Morgan Stanley Capital International, developed markets declined -1%, while emerging markets finished the week up 0.8%.
Commodities: Major commodities finished the week mixed. Precious metals closed to the downside with Gold giving up -0.4% to $1850.20 per ounce and Silver retreating -0.9% to $21.91. Energy had a second week of gains with West Texas Intermediate crude oil rising 3.3% to $118.87 per barrel and Brent crude adding 4.7% to $121.05. The industrial metal copper, viewed by some analysts as a barometer of world economic health due to its wide variety of uses, finished the week up 3.8%.
May Summary:
Despite all the intra-month volatility, the majority of the U.S. benchmark indexes finished the month of May flat. The Dow Jones Industrial Average was essentially unchanged on a percentage basis, finishing down just 90 points for the month. It was a similar story for both the large cap S&P 500 and the small cap Russell 2000. The mid cap S&P 400 managed a 0.6% increase in the month of May, while the NASDAQ Composite ended the month down -2.1%.
For the month of May, Canada declined -0.2%, while the United Kingdom gained 0.8%. France and Germany ended the mixed with France declining -1% and Germany gaining 2.1%. China rallied 4.6% and Japan added 1.6%. Developed markets finished the month up 2%. Emerging markets added 0.6%.
Gold and Silver finished the month of May down -3.3% and -6.1%, respectively, while West Texas Intermediate rallied 9.5%. Brent gained 9%. Copper finished the month down -2.6%.
U.S. Economic News: The number of people filing for first-time unemployment benefits fell by 11,000 last week to just 200,000, reflecting one of the strongest labor markets in decades. Economists had expected initial jobless claims to total 210,000. Applications for unemployment benefits have fallen the last two weeks after hitting a four-month high in early May. Claims fell the most in Kentucky, Pennsylvania, Georgia, and Florida. California and Mississippi were the only states to post sizable increases. Meanwhile, the number of people already collecting benefits, continuing claims, fell by 34,000 to 1.31 million. That number is still at its lowest level since 1969.
The country added a stronger-than-expected 390,000 new jobs in May, signaling the labor market and the broader economy remain resilient despite mounting macroeconomic pressures. Economists had forecast an increase of just 328,000 new jobs after reports leading up to the release hinted at slower hiring. The increase in employment was the smallest in 13 months, however. Overall, the unemployment rate remained unchanged at 3.6%--just a tick below the pre-pandemic low. The size of the labor force grew by 330,000 in May, nudging the participation rate up to 62.3% from 62.2%. Analysts noted the stronger-than-expected report is likely to allow the Fed to continue hiking rates. Restaurants and hotels again led the way in hiring, adding 84,000 jobs. Employment also rose by 75,000 at professional businesses, 47,000 in transportation and warehousing, and 36,000 in construction. Chief economist Bill Adams of Comerica Bank stated, “Another month of solid job growth in May is further evidence that the U.S. economy was not in a recession in the spring.”
The number of job openings dropped by roughly half a million in April to 11.4 million open positions, according to the latest data from the Labor Department. Furthermore, the number of people who quit their jobs remained little changed at 4.4 million. Quits topped 4 million last summer for the first time on record, part of a pandemic-era trend that became known as “the great resignation”. Prior to COVID, the number of people quitting jobs averaged fewer than 3 million per month. Analysts note the U.S. labor market may be the economy’s saving grace as the Federal Reserve moves to raise interest rates to tame inflation. Higher rates are likely to slow the economy, however as long as workers feel secure in their jobs, they’re likely to keep spending—and steady consumer spending should help the economy avoid a recession. Job openings fell the most in health care and social services (-266,000), retail (-162,000) and hotels and restaurants (113,000). Openings rose in manufacturing, transportation and warehousing. The so-called “quits rate” remained unchanged at 2.9% for the third month in a row.
Home prices rose again, hitting all-time highs despite mortgage rates also being on the rise. The S&P CoreLogic Case-Shiller 20-city home price index was up a record 21.2% year-over-year in March and up 3.1% from the previous month. Once again, Phoenix had the highest rate of home-prices in the country--up a whopping 32% from the same time last year. Dallas was second with a 30.7% annual increase. However, Rubeela Farooqi, chief U.S. economist at High Frequency Economics noted that home prices are bound to slow as mortgage rates continue to rise. The rate on a 30-year fixed rate mortgage has almost doubled to 5.25% from 2.75% last fall.
Manufacturing activity increased in May according to the latest report from the Institute for Supply Management (ISM). ISM reported its Manufacturing Purchasing Managers’ Index (PMI) rose to 56.1 in May from 55.4 in the prior month. The reading exceeded the consensus forecast of a decline to 54.5. In the report, the index for new orders rose 1.6 points to 55.1 as demand continues to increase despite higher prices. Employment, however, pulled back 1.3 to 49.6. All of the six biggest manufacturing industries posted moderate-to-strong growth in May. Ian Shepherdson, chief economist at Pantheon Macro stated, “Fears of a near-term rollover in the sector look overdone, though we think that the ISM index will soften over the next few months before recovering somewhat in the fall.”
The vastly larger ‘services’ side of the U.S. economy expanded at its slowest pace since early last year, in a similar report from ISM. ISM reported its Services PMI dropped to 55.9 from 57.1 in May—its lowest reading since February of 2021. Economists had expected a reading of 56.7. Still the reading signaled growth--numbers over 50 are considered positive, while readings over 55 are considered exceptional. The decline was led by a decline in business activity and slowing supplier deliveries. Business activity slumped 4.6 points to 54.5. Analysts at Contingent Macro Advisors wrote that while service industry growth was decelerating, it remains historically strong. “There are (so far) few signs that this slowdown is more than just an expected deceleration after heightened activity,” they wrote.
The confidence of America’s consumers dipped in May over worries about higher inflation and a slowing U.S. economy. The Conference Board reported its Consumer Confidence Index dropped 2.2 points to 106.4 in May. Still, the reading exceeded the consensus forecast of 103.9. The measure of how consumers feel about the economy right now slipped to 149.6 from 152.9. Some respondents stated the jobs market was not quite as strong as it was a few months ago. A similar gauge that looks ahead six months fell to 77.5 from 79. Lynn Franco, senior director of economic indicators at the board stated consumers don’t “foresee the economy picking up steam in the months ahead.” “Inflation remains top of mind for consumers,” she added.
The Federal Reserve’s ‘Beige Book’, a collection of anecdotal reports from each of its regional banks, found the U.S. economy showed “slight or modest” growth in May, but so did worries about a recession. “Contacts tended to cite labor market difficulties as their greatest challenge, followed by supply chain disruptions,” the survey stated. Rising interest rates, inflation, and international conflict rounded out other concerns weighing on respondents. The Federal Reserve has raised its key short-term interest rates twice this year to try to reign in the worst outbreak of inflation in 40 years.
International Economic News: The Bank of Canada appears to have concluded it will need to lift its benchmark interest rate to at least 3% to counter rising inflation. Canada’s benchmark rate is currently 1.5% following a half-point increase on June 1. Before the pandemic, Canada’s benchmark interest rate was at 1.75%--which was the highest policymakers managed to achieve following the 2008 financial crisis. Following the ‘Great Recession’, inflation hadn’t been an issue for many of the world’s developed economies. But, as Paul Beaudry, one of the central bank’s deputy governors, said in a speech on June 2, the “situation today is totally different.” The consumer price index between 2010 and 2020 never increased more than 3.7% on a year-over-year basis. In April, the index surged 6.8%, the second-biggest increase since the early 1980s. Inflation has now exceeded the high end of the Bank of Canada’s comfort zone of 1-3% for 12 consecutive months--unprecedented since the central bank adopted the index as its guide for policy in 1991.
Across the Atlantic, the United Kingdom marked a milestone in trade relations with the United States by signing its first state-level trade and economic development Memorandum of Understanding (MoU) with Indiana. The MoU creates a framework to remove barriers to trade and investment, paving the way for the United Kingdom and Indiana businesses to invest, export, expand and create jobs. The UK is the seventh largest export market for Indiana, and the state buys $1.4 billion worth of goods from the UK. In Indiana, International Trade Minister Ranil Jayawardena said, “With the signing of this MoU, British businesses can capitalize on the great opportunities for collaboration in areas like innovation and manufacturing.” In the United Kingdom, Secretary of State for International Trade Anne-Marie Trevelyan said, “This is Global Britain in action, making innovative deals on the world stage--and will help UK companies grow faster, innovate more and support jobs and economic growth.”
On Europe’s mainland, inflation in France continued to rise in May, reaching an annualized 5.2%--up 0.4% from April. As in previous months, inflation is primarily driven by energy prices, up 28% year-on-year mainly due to higher oil prices. However, price increases were across the board with food prices up 4.2% year-over-year, manufactured goods up 2.9%, and services up 3.2%. In all major categories, inflation was well above the ECB’s intended target of 2%. France’s national statistics agency INSEE reported gross domestic product contracted by 0.2% in the first three months of the year. France's worse-than-estimated performance puts an end to the country's strong economic rebound from the pandemic and poses a challenge to President Emmanuel Macron, who was re-elected just last month.
Germany’s annual inflation rate accelerated to 7.9% in May, its highest level in nearly 50 years, according to Germany’s Federal Statistics Office. Inflation jumped 0.5% from April, with energy prices more than 38% higher than the same time last year. Germany’s current inflation rate is the highest since the winter of 1973-1974 when an oil crisis fueled sharply higher energy prices. In comments shortly before the latest inflation figure was released, Finance Minister Christian Lindner said that the top priority must be fighting inflation. “Inflation is an enormous economic risk, and we must fight this inflation so that no economic crisis grows out of it, so that no spiral develops through which inflation feeds itself,” Lindner said.
In China, the city of Shanghai has lifted its two-month lockdown, much to the relief of its 25 million residents. Citizens of Shanghai have spent the last two months under a ruthlessly enforced lockdown. The prolonged isolation fueled anger and rare protests inside China’s most populous metropolis, battered the city’s manufacturing economy, and disrupted supply chains around the world. Shanghai Port is the world’s largest container port and a major transportation hub. Jubilant residents took to social media to celebrate with comments such as one WeChat user wrote: “We often said Shanghai was ‘liberated’ in 1949. Today, it’s another ‘liberation’!”
Japan’s parliament enacted a 2.7 trillion yen ($21 billion) extra budget to tackle soaring fuel and food prices. The extra budget is for the current fiscal year that started April 1 and will fund part of a 6.2 trillion yen ($48 billion) emergency economic package that Prime Minister Fumio Kishida’s government adopted in late April. Nearly 1.2 trillion yen ($9.4 billion) will be used to extend the current oil subsidy program through the end of September. Crude oil prices have risen sharply due to fears of disruptions in supplies from Russia due to its invasion of Ukraine. Wheat and corn prices are also up significantly, prompting food prices to soar.
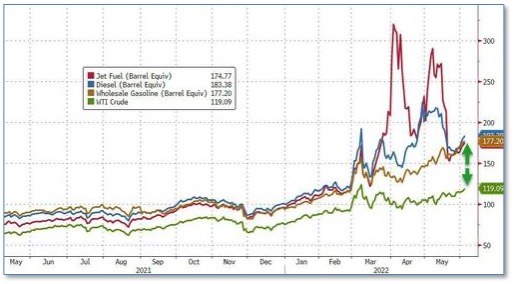
Finally: The Biden administration is at once demanding that U.S. oil producers pump more in order to lower prices at the pump, while at the same time the administration is blasting U.S. refiners and producers for “gouging” and looking at punishing them with a “windfall tax”. To address these concerns, Chevron CEO Mike Wirth appeared on Bloomberg TV stating that adding refinery capacity is incredibly difficult, especially in the current environment. Wirth stated, “You’re looking at committing capital 10 years out, that will need decades to offer a return for shareholders, in a policy environment where governments around the world are saying: we don’t want these products.” “We’re receiving mixed signals in these policy discussions,” Wirth added. The United States hasn’t had a new refinery built since the 1970’s. As the following graphic shows, the rate of price increases for refined products like jet fuel, diesel, and gasoline, have surged far higher than the price of crude oil.

(Sources: All index- and returns-data from Yahoo Finance; news from Reuters, Barron’s, Wall St. Journal, Bloomberg.com, ft.com, guggenheimpartners.com, zerohedge.com, ritholtz.com, markit.com, financialpost.com, Eurostat,0020Statistics Canada, Yahoo! Finance, stocksandnews.com, marketwatch.com, wantchinatimes.com, BBC, 361capital.com, pensionpartners.com, cnbc.com, FactSet.com)

