JUNE 2021 Inflation Data Surprises Index
Submitted by The Blakeley Group, Inc. on December 29th, 2021The very big picture (a historical perspective):
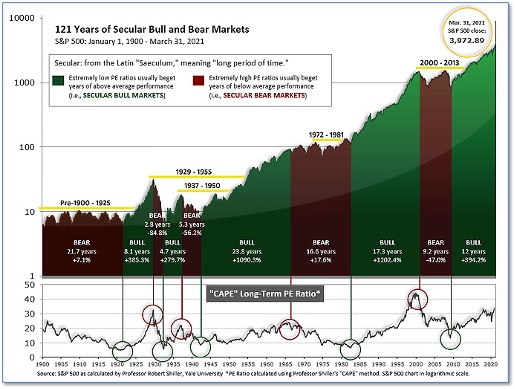
The long-term valuation of the market is commonly measured by the Cyclically Adjusted Price to Earnings ratio, or “CAPE”, which smooths-out shorter-term earnings swings in order to get a longer-term assessment of market valuation. A CAPE level of 30 is considered to be the upper end of the normal range, and the level at which further PE-ratio expansion comes to a halt (meaning that further increases in market prices only occur as a general response to earnings increases, instead of rising “just because”). The market was recently at that level.
Of course, a “mania” could come along and drive prices higher - much higher, even - and for some years to come. Manias occur when valuation no longer seems to matter, and caution is thrown completely to the wind - as buyers rush in to buy first, and ask questions later. Two manias in the last century - the “Roaring Twenties” of the 1920s, and the “Tech Bubble” of the late 1990s - show that the sky is the limit when common sense is overcome by a blind desire to buy. But, of course, the piper must be paid, and the following decade or two were spent in Secular Bear Markets, giving most or all of the mania-gains back.
The Very Big Picture: 120 Years of Secular Bulls and Bears

Figure 1
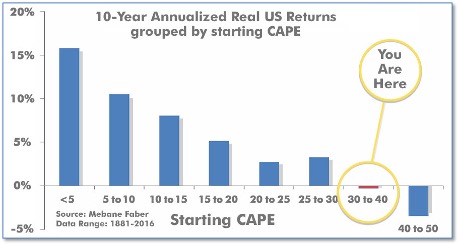
See Fig. 1 for the 100-year view of Secular Bulls and Bears. The CAPE is now at 37.28, up from the prior week’s 36.86. Since 1881, the average annual return for all ten-year periods that began with a CAPE in the 30-40 range has been slightly negative (see Fig. 2).
Note: We do not use CAPE as an official input into our methods. However, if history is any guide - and history is typically ‘some’ kind of guide - it’s always good to simply know where we are on the historic continuum, where that may lead, and what sort of expectations one may wish to hold in order to craft an investment strategy that works in any market ‘season’ … whether current one, or one that may be ‘coming soon’!
The Very Big Picture: Historical CAPE Values
Current reading: 37.28

Figure 2
The big picture:
As a reading of our Bull-Bear Indicator for U.S. Equities (comparative measurements over a rolling one-year timeframe), we remain in Cyclical Bull territory.
The complete picture:
Counting-up of the number of all our indicators that are ‘Up’ for U.S. Equities (see Fig. 3), the current tally is that four of four are Positive, representing a multitude of timeframes (two that can be solely days/weeks, or months+ at a time; another, a quarter at a time; and lastly, the {typically} years-long reading, that being the Cyclical Bull or Bear status).
The Current ‘Complete Picture’:

In the markets:
U.S. Markets: U.S. stocks recorded solid gains for the week, bringing the benchmark S&P 500 Index nearly back to its all-time highs. The Dow Jones Industrial Average gained 322 points to close at 34,529, a rise of 0.9%. The technology-heavy NASDAQ Composite had its second week of gains, adding 2.1%. By market cap, the large cap S&P 500 rose 1.2%, while the mid cap S&P 400 and small cap Russell 2000 indexes added 1.4% and 2.4%, respectively.
International Markets: Major international markets finished the week in the green. Canada’s TSX rose 1.7%, while the United Kingdom’s FTSE 100 ticked up 0.1%. France’s CAC 40 and Germany’s DAX rose 1.5% and 0.5%, respectively, while in Asia, China’s Shanghai Composite rose 3.3%. Japan’s Nikkei ended the week up 2.9%. As grouped by Morgan Stanley Capital International, emerging markets rose 3.3%, while developed markets added 1.0%.
Commodities: Precious metals continued their rise for a fourth week. Gold rose 1.5% to $1905.30 per ounce, while Silver finished the week up 1.9% to $28.01. Oil continued to consolidate near its highs reached in early March. West Texas Intermediate crude oil finished the week up 4.3% to $66.32 per barrel. The industrial metal copper, viewed by some analysts as a barometer of global economic health due to its wide variety of uses, retraced last week’s decline finishing the week up 4.4%.
May Summary: U.S. markets were mixed for the month of May. The Dow Jones Industrial Average rose 1.9%, while the NASDAQ Composite gave up -4.4%. The large cap S&P 500 gained 0.5%, and the md cap S&P 400 and small cap Russell 2000 each ticked up a scant 0.1%. International markets outperformed U.S. indices for the month of May. Canada and the UK rose 3.9% and 0.8%, while France added 3.4% and Germany gained 2.5%. China finished the month up 4.5% and Japan added 1.2%. Emerging markets rose 1.6% in May while developed markets added 3.5%. Precious metals had an especially strong month with Gold rallying 7.8% and Silver surging 8.3%. Oil and copper gained 4.3% and 4.7%, respectively.
U.S. Economic News: The number of Americans applying for first-time unemployment benefits fell to new pandemic lows as the U.S. economy continued to recover and companies to hired more workers. The Labor Department reported initial jobless claims sank by 38,000 to 406,000 in the week ended May 22. That was the fewest number of compensation claims since the onset of the pandemic nearly 15 months ago. Economists had forecast new claims would total a seasonally-adjusted 425,000. New requests were down sharply from the nearly 900,000 readings seen in early January. Meanwhile, the number of people already collecting benefits, so-called “continuing claims”, fell by 96,000 to a seasonally-adjusted 3.64 million. That reading is reported with a one-week delay.
Home prices continued to accelerate in March, rising at their fastest pace since 2005. Analytics firm S&P CoreLogic Case-Shiller reported the index of home prices across 20 large cities increased at an annual pace of 13.3% in March. Among the 20 cities that the index tracks, Phoenix again saw the largest increase with a 20% jump, followed by San Diego (up 19.1%) and Seattle (up 18.3%). On a monthly basis, home prices were up 1.6%. Craig Lazzara, managing director and global head of index investment strategy at S&P DJI stated, “The market’s strength is broadly-based: all 20 cities rose, and all 20 gained more in the 12 months ended in March than they had gained in the 12 months ended in February.” Separately, the national home price index, which measures home prices across the country, rose a similar 13.2% over the past year. The latest reading is the highest annual gain since December 2005.
Sales of new homes fell in April by nearly 6% as affordability constraints begin to weigh on home buyers. The U.S. Census Bureau reported new residential sales occurred at a seasonally-adjusted annual rate of 863,000. Despite the lower reading, new home sales were still up 48% compared to the same time last year. The median forecast of economists polled was 959,000. Analysts noted the decline in mortgage demand could be a reflection of both buyers’ and builders’ concerns about affordability, as mortgage rates have risen this year alongside home prices. The market for new homes is seeing price pressures not just due to the high demand for housing but also because of rising material costs that are driving construction expenses substantially higher.
For the first time in six months, the confidence of American consumers slipped as they grew more worried about the rising cost of living and future job prospects. The Conference Board reported its closely followed survey of consumer confidence slipped 0.3 point to 117.2 in May. Economists had forecast a reading of 119.5. All three major surveys of consumer confidence declined in May even as states loosened or eliminated altogether restrictions put in place during the pandemic. Nonetheless, the reopening of the economy combined with massive federal stimulus has unleashed a surge in pent-up demand. That demand has pushed the cost of many goods and services to record highs, increasing worries of inflation. The part of the survey that asks how consumers feel about the economy right now surged again to 144.3 from 131.9--a new pandemic high. However, the measure of how Americans view the next six months sank to 99.1 from 107.9—a three-month low.
A key measure of inflation rose again last month hitting a 13-year high, reflecting the broad surge in consumer prices as the U.S. fully reopens for business. The Personal Consumption Expenditures Index climbed to 3.6% in April from the same time a year earlier, hitting its highest level since 2008 and well above the Federal Reserve’s stated 2% goal. A separate measure of inflation that strips out food and energy also rose to its highest level since 1992. Still, the Federal Reserve insists inflation will fade to its 2% target by next year, once the economy is on firmer footing and the pandemic is well behind us.
Orders for goods expected to last at least three years, so-called “durable goods”, fell last month for the first time in a year. The Census Bureau reported orders for durable goods slipped 1.3% in April. Economists had expected a 0.9% increase. The decline stemmed almost entirely from a big drop in orders for new cars and trucks. Automakers have plenty of demand, but they can’t fill new orders fast enough because of an ongoing global shortage of computer chips. These shortages are likely to drag on for months until bottlenecks created by the pandemic are eliminated and pent-up demand is filled. Excluding transportation, new orders rose a healthy 1.1% in April. The best news in the report was a 2.3% increase in business investment. Companies are now investing more than they did before the pandemic and it’s likely to keep going up, economists say.
International Economic News: Canada’s central bank is likely to cut its bond-buying program again this year, as provinces ease curbs to contain the coronavirus pandemic and inflation pressures build. Strategists from half of Canada’s six largest banks expect the Bank of Canada to dial back its bond purchases to 2 billion CAD ($1.65 billion USD) per week or less, from the current level of 3 billion CAD per week. In April, the Bank of Canada became the first major central bank to cut back on pandemic-era money-printing stimulus programs and indicated it could begin raising its key interest rate from the current floor of 0.25% in the second half of the year. It said further cuts to bond purchases would be guided by its assessment of the "strength and durability" of economic recovery.
Across the Atlantic, British shoppers hit retailers en masse after shops reopened following months of lockdown closures, official data showed. Sales volumes jumped 9.2% in April, twice the average forecast of economists and the biggest rise since June, after rising 5.1% in March. Clothing sales surged by almost 70%. Alex Jones, head of retail at Lloyds Bank stated, “Fashion retailers (were) the ultimate beneficiaries of beer gardens reopening and the 'rule of six' night out returning.” Bank of England policymakers are keeping a close watch on retail sales, expecting a surge in spending as wealthier households spend savings built up during lockdowns. The central bank forecast this month that the economy would grow by 7.25% this year after slumping by nearly 10% in 2020, its biggest decline in more than 300 years.
On Europe’s mainland, in a joint statement by German Economy Minister Peter Altmaier, his French counterpart Bruno Le Maire, and Dutch Economic Affairs Minister Mona Keljzer said draft rules targeted at Alphabet unit Google, Facebook, Amazon, and Apple should be beefed up to allow regulators to limit their acquisitions of start-up rivals. Tech giants have faced criticism for so-called “killer acquisitions” where they buy nascent rivals with the goal of shutting them down. Regulators should use the proposed Digital Markets Act (DMA) to address this issue, the ministers said. "First, setting clear and legally certain thresholds for acquisitions by gatekeepers of targets," they said. "Second, adapting the substantive test to effectively address cases of potentially predatory acquisitions." They said the proposed rules should allow leeway for EU countries to tackle so-called online gatekeepers and anti-competitive behavior.
In Asia, just days before the coronavirus shut down the Chinese city of Wuhan, the Trump administration and China signed what both sides said would be only a temporary truce in their 18-month trade dispute. President Biden now sits as president of the United States but the truce endures, and now appears to be setting lasting ground rules for global trade. The agreement didn’t stop many of the same practices that sparked the trade war, such as Chinese subsidies at a range of its industries—many of them reliant on American technology. In return, the truce left in place most of the $360 billion-a-year tariffs imposed on Chinese-made goods. However, the truce appears to be the foundation for the European Union’s trade agreement. The European Union announced earlier this month that it was drafting legislation that would allow it to broadly penalize imports and investments from subsidized industries in China or elsewhere.
Japan’s government slashed its overall economic view for the first time in three months in its economic report for May. The downgrade was due to the impact on consumption and business conditions from the coronavirus state of emergency imposed on major areas of the country. "The economy shows increased weakness in some parts, though it continued picking up amid severe conditions due to the coronavirus," the government said in the report. The government cut its assessment of the overall economy for the second time this year, after also doing so in February, which was its first downgrade in 10 months.
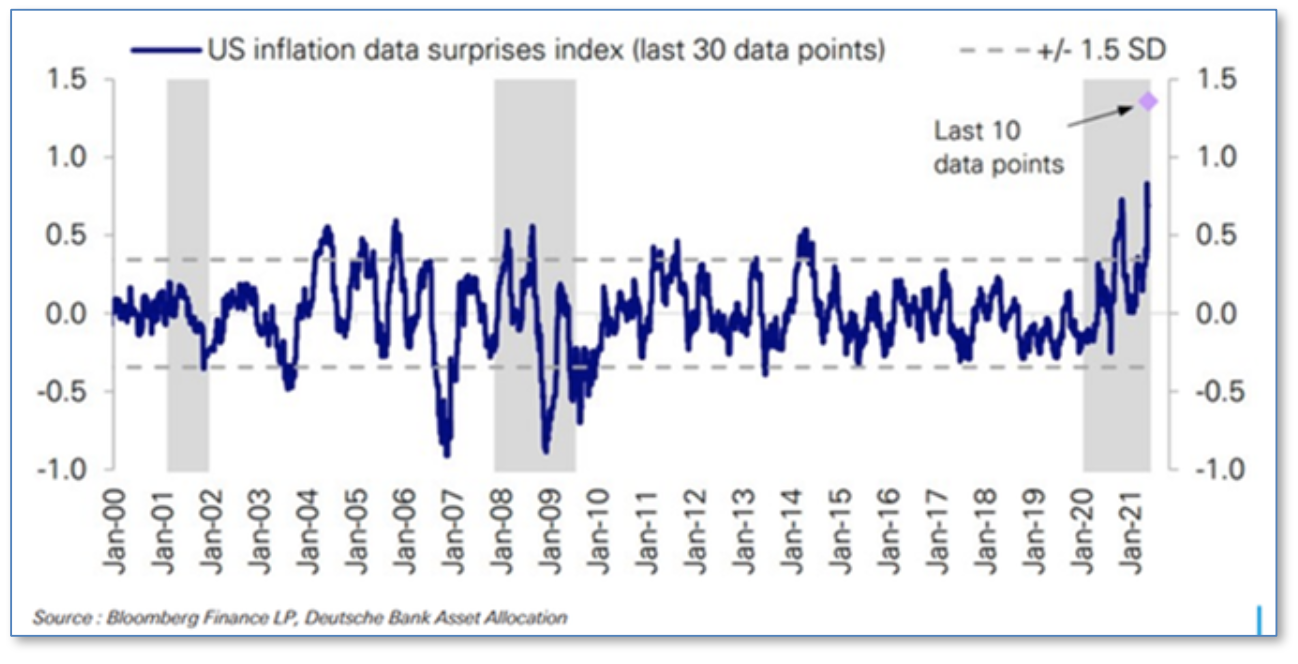
Finally: Despite the Fed’s insistence that the present jump in inflation readings is “transient” and “temporary”, indications of widespread inflation are becoming so numerous as to be overwhelming. Deutsche Bank maintains a data series it calls the “Inflation Data Surprises Index”, which monitors unexpectedly-high or –low inflation reports across the economy. The current readings are the highest in the 20-year history of the index. Deutsche Bank strategist Jim Reid described the last 10 data points as “almost off the chart”. (Chart from Deutsche Bank).

(Sources: All index- and returns-data from Yahoo Finance; news from Reuters, Barron’s, Wall St. Journal, Bloomberg.com, ft.com, guggenheimpartners.com, zerohedge.com, ritholtz.com, markit.com, financialpost.com, Eurostat, Statistics Canada, Yahoo! Finance, stocksandnews.com, marketwatch.com, wantchinatimes.com, BBC, 361capital.com, pensionpartners.com, cnbc.com, FactSet.)

