JUNE 2016: U.S. Stocks had their best week since March
Submitted by The Blakeley Group, Inc. on June 2nd, 2016"All that is gold does not glitter; nor all those that wander are lost."
~ J. R. R. Tolkien
NOTE: Areas with blue text show the most recent market updates since the May Capital Highlights email.
The very big picture:
In the "decades" timeframe, the question of whether we are in a continuing Secular Bear Market that began in 2000 or in a new Secular Bull Market has been the subject of hot debate among economists and market watchers since 2013, when the Dow and S&P 500 exceeded their 2000 and 2007 highs. The Bear proponents point out that the long-term PE ratio (called “CAPE”, for Cyclically-Adjusted Price to Earnings ratio), which has done a historically great job of marking tops and bottoms of Secular Bulls and Secular Bears, did not get down to the single-digit range that has marked the end of Bear Markets for a hundred years, but the Bull proponents say that significantly higher new highs are de-facto evidence of a Secular Bull, regardless of the CAPE. Further confusing the question, the CAPE now has risen to levels that have marked the end of Bull Markets except for times of full-blown market manias. See Fig. 1 for the 100-year view of Secular Bulls and Bears.
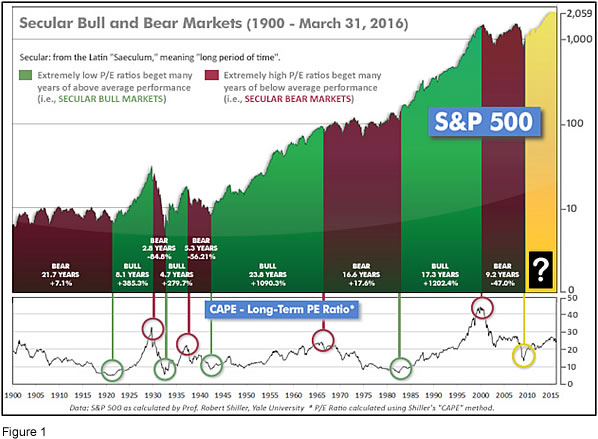
Even if we are in a new Secular Bull Market, market history says future returns are likely to be modest at best. The CAPE is at 26.22, up from the prior week's 25.64 after having earlier reached the level also reached at the pre-crash high in October, 2007. Since 1881, the average annual returns for all ten year periods that began with a CAPE around this level have been just 3%/yr (see Fig. 2).
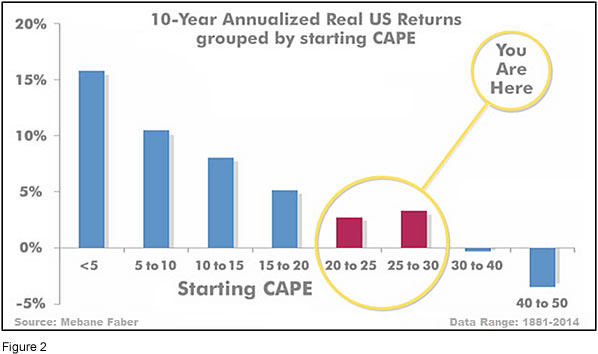
This further means that above-average returns will be much more likely to come from the active management of portfolios than from passive buy-and-hold. Although a mania could come along and cause the CAPE to shoot upward from current levels (such as happened in the late 1920’s and the late 1990’s), in the absence of such a mania, buy-and-hold investors will likely have a long wait until the arrival of returns more typical of a rip-snorting Secular Bull Market.
In the big picture:
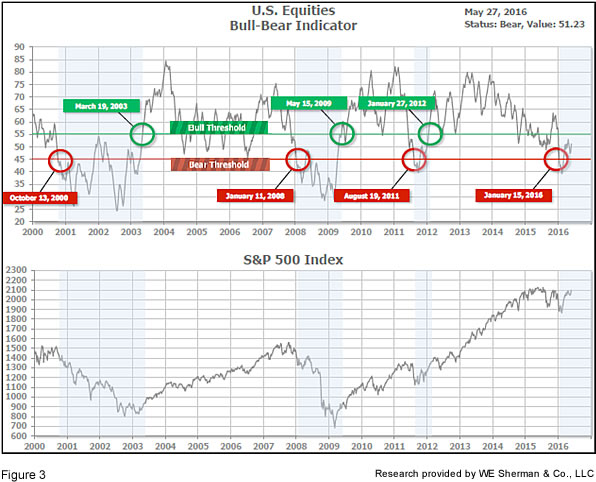
The “big picture” is the months-to-years timeframe – the timeframe in which Cyclical Bulls and Bears operate. The US Bull-Bear Indicator (see Fig. 3) turned negative on January 15th, and remains in Cyclical Bear territory at 51.23, up from the prior week’s 47.86.
In the intermediate picture:
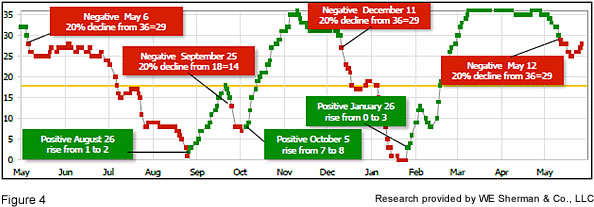
The intermediate (weeks to months) indicator (see Fig. 4) turned positive on January 26th. The indicator ended the week at 28, up 3 from the prior week's 25. Separately, the quarter-by-quarter indicator - based on domestic and international stock trend status at the start of each quarter - gave a positive indication on the first day of April for the prospects for the second quarter of 2016.
Timeframe summary:
In the Secular (years to decades) timeframe (Figs. 1 & 2), whether we are in a new Secular Bull or still in the Secular Bear, the long-term valuation of the market is simply too high to sustain rip-roaring multi-year returns. The Bull-Bear Indicator (months to years) is negative (Fig. 3), indicating a new Cyclical Bear has arrived. The Quarterly Trend Indicator (months to quarters) is positive for Q2, and the Intermediate (weeks to months) timeframe (Fig. 4) is negative. Therefore, with two of the three indicators positive, the U.S. equity markets are rated as Mostly Negative.
In the markets:
U.S. stocks rose for a second consecutive week and had their best week since March on the heels of better economic data and higher oil prices. All major U.S. indexes were up, but SmallCaps and MidCaps outpaced their LargeCap counterparts. For the week, the Dow Jones Industrial Average rose +372 points (+2.13%) to end the week at 17,873. The S&P 500 LargeCap index gained +2.28%, the S&P 400 MidCap index added +2.89%, and the SmallCap Russell 2000 paced the pack with a strong +3.43% rise for the week. The NASDAQ also had a strong week, up +3.44%, and at 4,933 is once again nearing the 5000 level. Transports and Utilities were both bid higher, with the Dow Jones Transport Average rising +1.3% and the Dow Jones Utilities Average adding +0.95%.
In international markets, Canada’s TSX rose for a 3rd straight week, adding +1.33%. Likewise, all major European indexes showed decent gains. The United Kingdom’s FTSE rose +1.86%. On the mainland, France’s CAC 40 rallied +3.69%, Germany’s DAX gained +3.73%, and Italy’s Milan FTSE rose +2.1%. Asian markets were mixed with Japan’s Nikkei up +0.59%, China’s Shanghai Stock Exchange down a slight -0.16%, and Hong Kong’s Hang Seng up over +3.6%.
Commodities markets were mixed, with precious metals continuing to lose their luster. Gold declined -$37.60 to $1215.30 an ounce, a loss of -3% and silver fell -1.8% to $16.25 an ounce. However, the industrial metal copper rebounded from recent weakness up +2.65% and energy continued its rebound as a barrel of West Texas Intermediate crude oil closed at $49.56 up +2.23%.
In U.S. economic news, the number of Americans filing for first-time unemployment benefits fell more than expected last week as the labor market remains healthy and the economy appears to be regaining some momentum after a difficult first quarter. The claims number declined -10,000 to a seasonally adjusted 268,000 last week, according to the Labor Department, below the expected 275,000. Claims continue to remain below 300,000, a threshold traditionally associated with a strong labor market. The 4-week average rose slightly to 278,500.
Perhaps the broadest and most reliable gauge of the state of the job market can be gleaned from taxes withheld from paychecks for federal income and employment taxes. Analysis of daily Treasury statements funds by Investors Business Daily (IBD) revealed that the job market apparently grew +4.5% from a year ago. It was the fastest pace in 6 months and supports the view that the economy is strengthening after 2 weak quarters. The tax data, which doesn’t rely on statistical samples and seasonal adjustments, had previously been signaling weaker wage gains in contrast to the monthly employment reports which painted a rosier picture. The improvement in tax-receipt growth since last month could indicate another strong employment report is coming and along with a further rise in wage growth may open the door to a June interest rate hike by the Fed. On Monday, San Francisco Fed President John Williams stated that the U.S. is “basically at full employment or very near it.”
It was a very good week for U.S. Real Estate news.
Purchases of new homes in the U.S. surged last month to the highest level since the beginning of 2008. Sales jumped +16.6% to an annualized pace of 619,000 and purchases for the first 3 months of the year were revised higher, according to the Commerce Department. The sales rate exceeded even the most optimistic forecast in a Bloomberg survey. In addition, the median sales price reached a new record of $321,100 up +9.7% from April 2015, reflecting a pickup in signed contacts on more expensive properties (although, oddly, sales of mega-mansions in the multi-million dollar category are reportedly stagnating).
The number of homes sold and not yet under construction also climbed to its highest level since May of 2007. The gain in demand was led by the South where sales climbed +15.8% to a 352,000 annualized rate—the strongest in the South since December of 2007. The supply of homes on the market fell to 4.7 months from 5.5 months in March.
The National Association of Realtors reported that the Pending Home Sales Index surged +5.1% last month to the highest level since February 2006. Economists had only expected a +0.8% rise. The index suggests that actual existing-home sale closings should have strong readings in May and June as these pending contracts are finalized.
In U.S. manufacturing, durable goods orders spiked +3.4% last month, beating forecasts. But non-defense capital goods orders excluding aircraft (a closely watched proxy for business investment plans) fell -0.8% following a ‑0.1% drop the previous month. These “core capital goods orders” have now declined for 3 consecutive months. Economists had forecasted orders rising +0.5% and core capital goods orders increasing +0.4%. Manufacturing has continued to struggle with strength in the U.S. dollar and sluggish overseas demand.
The Commerce Department reported that the U.S. economy expanded at a slightly better pace in Q1 than originally reported. GDP in the first quarter rose +0.8%, up from the +0.5% initially reported, but still missing the +0.9% expected. Q1 consumer spending rose at a +1.9% pace, slightly missing expectations, while business investment fell sharply.
On Friday, Federal Reserve Chair Janet Yellen said that ongoing improvement in the U.S. economy would warrant another rate increase “in the coming months,” stopping short of giving a definite timeline of when the central bank might act. “It’s appropriate—and I’ve said this in the past—for the Fed to gradually and cautiously increase our overnight interest rate over time,” Yellen said during remarks at Harvard University. “Probably in the coming months such a move would be appropriate.” The next Federal Open Market Committee meeting will be held June 14-15, when the Fed will deliberate over a second interest-rate increase following 7 years of near-zero borrowing costs following the Great Recession. Yellen’s comments follow speeches by several regional Fed Presidents given in recent weeks hinting at the likelihood of a rate hike sooner rather than later.
In Canada, the Bank of Canada said that wildfires will hurt the economy as it held its key interest rate at 0.5%. Wildfires that razed parts of Fort McMurray and forced the shutdown of several oil sands operations will exact a toll on the economy, but asserted that it would be temporary. The central bank said its preliminary assessment is that the fires will cut 1.25% points off real GDP growth in the 2nd quarter.
In the United Kingdom, with a month to go before Britain votes on leaving the European Union (yes, the infamous “Brexit”), the U.K. Treasury issued a report that warned that the British economy could dive into a year-long recession should Britain leave the E.U. Analysts at the U.K. Treasury claim that the economy could slide more than -3.5% in the two years following a British exit from the E.U.
In the Eurozone, Markit released its flash estimates on manufacturing and services for May, showing manufacturing downticking -0.2 point to 51.5 from April (over 50 still signaling growth) and services reading 53.1. Germany’s flash manufacturing reading was 52.4 and services was 55.2, both higher than April’s readings, while France’s readings were 51.8 for services and 48.3 for manufacturing, both also exceeding April’s results.
In France, tear gas filled the air in Paris as authorities struggled with nationwide strikes and a groundswell of public anger in response to a labor bill that gives employers more flexibility and weakens the power of unions. The new labor law, tagged the “El Khomri Law” referring to French Labor Minister Myriam El Khomri, relaxes stifling labor rules regarding the 35-hour work week and lowers protections for workers from layoffs that employers maintain make them uncompetitive on the world market.
China’s central bank weakened its currency fixing to the lowest since March 2011 as the dollar strengthened. The reference rate was lowered -0.3% to 6.5693 per dollar. The dollar has been strengthening as traders place bets that interest rates in the U.S. will rise. A resurgent dollar is interfering with the strategy that the People’s Bank of China has been pursuing over the last few months of maintaining a steady rate against the dollar along with depreciation against other major currencies.
In Japan, leaders of seven leading industrialized countries, the so-called G-7, converged on Ise-Shima in Japan for a two-day summit (May 26th and 27th) to focus on the global economy and international security. Other topics of discussion included terrorism, cybersecurity and maritime security, including issues with China’s assertiveness in the East and South China Seas where territorial disputes have arisen between China and Japan, Viet Nam and the Philippines, among others.
Finally, it has historically been true that gold has benefited from a weak dollar. Recently, the flip side of that coin has come into play: gold has been punished by a stronger dollar. The inverse relationship has historically been less tight than now, leading some to fear that a continuation of the dollar’s rise (driven in large part by anticipation of Fed interest rate hikes) and a continuation of this strong inverse relationship would severely pummel gold prices. This chart shows how tight the inverse correlation has been over the last 9 months.

(sources: all index return data from Yahoo Finance; Reuters, Barron’s, Wall St Journal, Bloomberg.com, ft.com, guggenheimpartners.com, ritholtz.com, markit.com, financialpost.com, Eurostat, Statistics Canada, Yahoo! Finance, stocksandnews.com, marketwatch.com, wantchinatimes.com, BBC, 361capital.com, pensionpartners.com, cnbc.com, FactSet; Figs 1-5 source W E Sherman & Co, LLC)
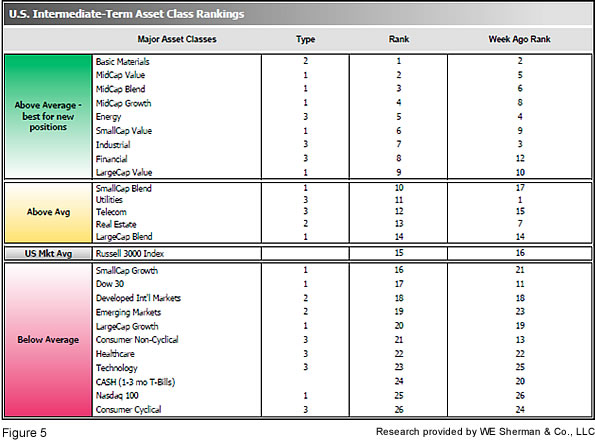
The ranking relationship (shown in Fig. 5) between the defensive SHUT sectors ("S"=Staples [a.k.a. consumer non-cyclical], "H"=Healthcare, "U"=Utilities and "T"=Telecom) and the offensive DIME sectors ("D"=Discretionary [a.k.a. Consumer Cyclical], "I"=Industrial, "M"=Materials, "E"=Energy), is one way to gauge institutional investor sentiment in the market. The average ranking of Defensive SHUT sectors fell 16.5, down from the prior's week's 12.8, while the average ranking of Offensive DIME sectors rose to 9.8 from the prior week's 8.3. The Offensive DIME sectors increased their lead over the Defensive SHUT sectors. Note: these are “ranks”, not “scores”, so smaller numbers are higher ranks and larger numbers are lower ranks.
Check out the latest article in the Resource area of our website:
"Hacking and Identity Theft: A Simple Step to Better Protect Yourself"
by Dick Blakeley

