June 2015 – Job Creation Accelerated to its Fastest Pace in a Year
Submitted by The Blakeley Group, Inc. on June 9th, 2015“I’d like to live as a poor man with lots of money.”
NOTE: Areas with blue text show the most recent market updates since the May Capital Highlights email.
The very big picture:
In the “decades” timeframe, the question of whether we are in a continuing Secular Bear Market that began in 2000 or in a new Secular Bull Market has been the subject of hot debate among economists and market watchers since 2013, when the Dow and S&P 500 exceeded their 2000 and 2007 highs. The Bear proponents point out that the long-term PE ratio (called “CAPE”, for Cyclically-Adjusted Price to Earnings ratio), which has done a historically great job of marking tops and bottoms of Secular Bulls and Secular Bears, did not get down to the single-digit range that has marked the end of Bear Markets for a hundred years, but the Bull proponents say that significantly higher new highs are de-facto evidence of a Secular Bull, regardless of the CAPE. Further confusing the question, the CAPE now has risen to levels that have marked the end of Bull Markets except for times of full-blown market manias. See Fig. 1 for the 100-year view of Secular Bulls and Bears.
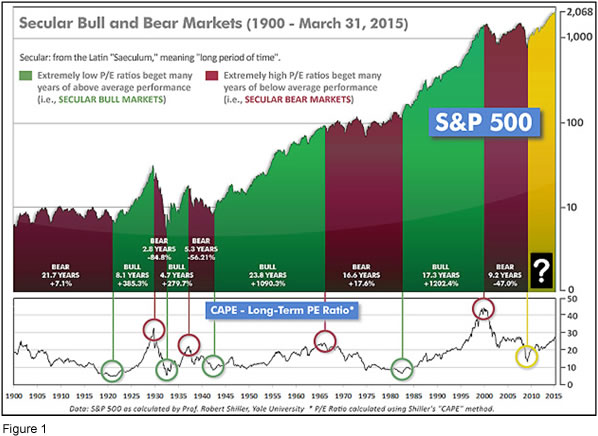
Even if we are in a new Secular Bull Market, market history says future returns are likely to be modest at best. The CAPE is at 27.2, down from the prior week’s 27.5, and approximately at the level reached at the pre-crash high in October, 2007. In fact, since 1881, the average annual returns for all ten year periods that began with a CAPE at this level have been just 3%/yr (see Fig. 2). (Note: all P/E references are to the Shiller P/E values, sometimes called PE10 or CAPE, which are calculated so as to remove shorter-term fluctuations; see robertshiller.com for details).
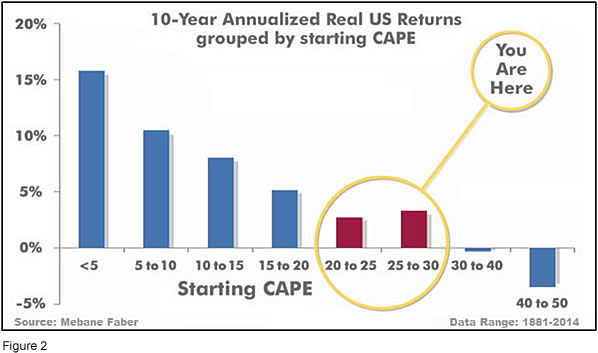
This further means that above-average returns will be much more likely to come from the active management of portfolios than from passive buy-and-hold. Although a mania could come along and cause the CAPE to shoot upward from current levels (such as happened in the late 1920’s and the late 1990’s), in the absence of such a mania, buy-and-hold investors will likely have a long wait until the arrival of returns more typical of a rip-snorting Secular Bull Market.
In the big picture:
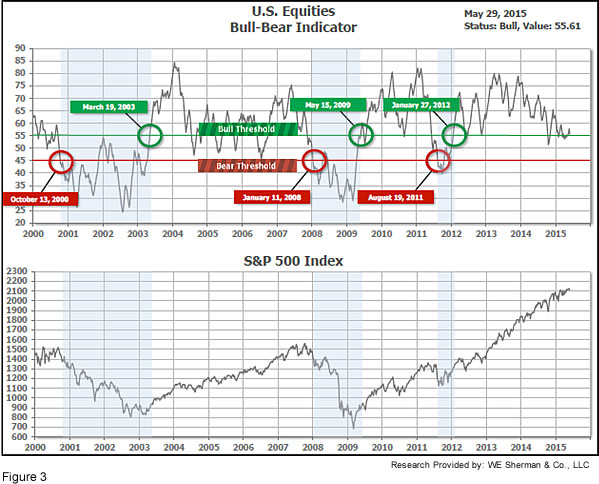
The “big picture” is the months-to-years timeframe – the timeframe in which Cyclical Bulls and Bears operate. The US Bull-Bear Indicator (see Fig. 3) is at 55.6, down from the prior week’s 57.8, and continues in cyclical Bull territory. The current Cyclical Bull has taken the US and some of Europe to new all-time highs, but many of the world’s major indices have yet to top 2007’s levels – particularly in the Emerging Markets area.
In the intermediate picture:
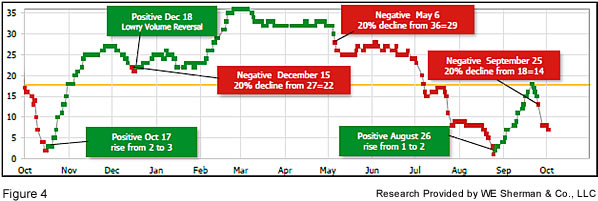
The intermediate (weeks to months) indicator (see Fig. 4) is Positive and ended the week at 27, unchanged from the week prior. Separately, the quarter-by-quarter indicator – based on domestic and international stock trend status at the start of each quarter – gave a positive indication on the first day of October for the prospects for the fourth quarter of 2014.
Timeframe summary:
In the Secular (years to decades) timeframe (Figs. 1 & 2), whether we are in a new Secular Bull or still in the Secular Bear, the long-term valuation of the market is simply too high to sustain rip-roaring multi-year returns. In the Cyclical (months to years) timeframe (Fig. 3), all major equity markets are in Cyclical Bull territory. In the Intermediate (weeks to months) timeframe (Fig. 4), US equity markets are again rated as Positive. The quarter-by-quarter indicator gave a positive signal for the 1st quarter: US equities were in an uptrend, while International equities were in a downtrend at the start of Q1 2015, and either one being in an uptrend is sufficient to signal a higher likelihood of an up quarter than a down quarter.
In the markets:
The major US indexes ended lower for the week as the Dow gave up 221 points, or -1.21%, to barely maintain the Consumer Spending Rose 1.8% … June Capital Highlights18,000 level at 18010. The LargeCap S&P 500 lost -0.88%, to close at 2107. The tech heavy Nasdaq declined ‑0.38%, holding above the 5,000 mark at 5070. The SmallCap Russell 2000 lost -0.45%, and the MidCap 400 gave up ‑1.10%. Canada’s TSX lost for the fourth week in five, shedding -1.23%.
Emerging International Markets lost -3.79% for the week, while Developed International was down -1.97%. Most European indices gave up -2% to -4%, and Brazil led the parade of losers at -5.73%. Japan’s Nikkei was an exception, gaining +1.47%.
In commodities, the price for a barrel of crude flattened out holding steady at $60.23, up +0.40%. Gold declined ‑1.24%, to close at $1190.50 an ounce. Silver, almost always more volatile, gave up -2.31% to close at $16.71 an ounce.
Despite the downbeat ending of the month, May was positive for US markets. The Dow was the least positive, at +0.95% for May, and the Nasdaq composite was the most positive, at +2.6%. The S&P 500 rose +1.05%, the SmallCap Russell 2000 gained +2.16% and the MidCap 400 advanced +1.63%. Canada’s TSX was not so lucky, shedding -1.38% for May. The rest of the world was a mixed picture. Developed International went up a small +0.20%, but the Emerging Markets group plunged ‑4.10% in May. The swings were most pronounced in China and Brazil (many have observed that Brazil seems to be a delayed mirror of China these days, since such a large % of Brazil’s GDP is now in trade with China).
In economic news, the Commerce Department reported that first quarter GDP contracted ‑0.7%. The revised figure was much worse than the government’s initial estimate of a +0.2% growth rate. It should be noted that the first quarter of 2014 was also a GDP contraction. Consumer spending, which accounts for about 70% of economic activity, grew only +1.8%. Business investment declined -2.8%, which was the biggest decline since 2009. One of the biggest hits to business investment came from huge cutbacks in drilling activities for energy companies. The Chicago Purchasing Managers Index (PMI) for manufacturing fell -6 points to 46.2, near a 6-year low of 45.8. Expectations were for an uptick to 53.1. Above 50 is expansion, below 50 is contraction in the PMI.
Initial jobless claims increased a modest 7,000 to a still low 282,000. Initial claims have remained near 15-year lows for several weeks now. Continuing claims gained 11,000 to 2.222 million, the lowest since November, 2000.
Orders for durable goods declined -0.5% in April, not quite as bad as consensus estimates of a -0.6% decline. Orders excluding transportation increased +0.5%, beating expectations by one tick. On a positive note, core capital goods orders, which often serve as a proxy for business investment intentions, gained +1% – hopeful news for second quarter GDP.
The Services PMI declined -1 point to 56.4 in May, but remained in solid expansion territory. Job creation accelerated to its fastest pace in a year, and the year-ahead optimism index also rose to the highest since late last year. The Conference Board reported that consumer confidence improved in May to 95.4, beating expectations of 95.1. The component that gauges opinions of “the present situation” gained+ 3 points to 108.1.
New-home sales rose 6.8% to an annual rate of 517,000 in April, expectations were for 509,000. Sales have remained over 500,000 for four of the first five months of 2015 – much hotter than in 2014. The S&P/Case-Shiller home price index was also stronger in April, with a +1% gain for the month and +5% higher year over year. San Francisco and Denver held the top spots for price gains. Nationally, prices are still about 15% lower than the 2006 peak.
Canadian GDP contracted -0.6% in Q1 vs the previous quarter, missing expectations of a +0.2% gain. It was the first decline in almost 4 years and was due to the steep drop in oil and gas activity. Industrial product prices fell ‑0.9% in April in Canada, much steeper than expected, and are now down ‑2.4% vs. a year ago. The price index for raw materials increased +3.8% vs. expectations of a ‑1.6% decline, but the index is still -20.9% lower than last year’s levels.
Getting frugal German consumers to loosen their purse strings has been a very difficult task over the last few years while Europe flirted with several recessions and the Greek government openly disparaged Germany and Germans. However, there are recent signs that German consumers may be coming around. Consumer sentiment in Germany was stronger than expected in April, according to market-research firm GfK, rising to the highest reading since 2001. A sub-gauge of “buying willingness” improved to its highest since 2006.
A top IMF official stated that the Chinese yuan is no longer undervalued. China has been pressing to have the currency considered part of the Fund’s special reserve assets—having the yuan considered fairly valued is a major step toward that goal.
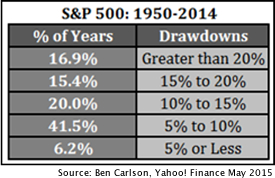
Advisor and author Ben Carlson published an article on Yahoo! Finance this week titled “To Win in the Stock Market You Have to be Willing to Lose”. He analyzed the S&P 500’s worst drawdowns (measured as the decline from market peak to subsequent trough) from 1950-2014 and related the findings to 2 different types of investors—those who obsess over the next 5-10% correction and those that have become so complacent they don’t think about it at all. He points out that both attitudes can be hazardous to one’s financial health because both types are set up to over-react to the market’s historically-typical movements. More than half of all years have experienced a drawdown of -10% or more, and a sixth of all years suffered a -20% or greater loss. There were only 4 years – 1954, 1958, 1964, and 1995 – in which stocks didn’t have at least a -5% correction at some point during the year.
(sources: Reuters, Barron’s, Wall St Journal, Bloomberg.com, ft.com, guggenheimpartners.com, ritholtz.com, markit.com, financialpost.com, Eurostat, Statistics Canada, Yahoo! Finance, stocksandnews.com, wantchinatimes.com, BBC, 361capital.com, pensionpartners.com; Figs 3-5 source W E Sherman & Co, LLC)
The ranking relationship (shown in Fig. 5) between the defensive SHUT sectors (“S”=Staples [a.k.a. consumer non-cyclical], “H”=Healthcare, “U”=Utilities and “T”=Telecom) and the offensive DIME sectors (“D”=Discretionary [a.k.a. Consumer Cyclical], “I”=Industrial, “M”=Materials, “E”=Energy), is one way to gauge institutional investor sentiment in the market.
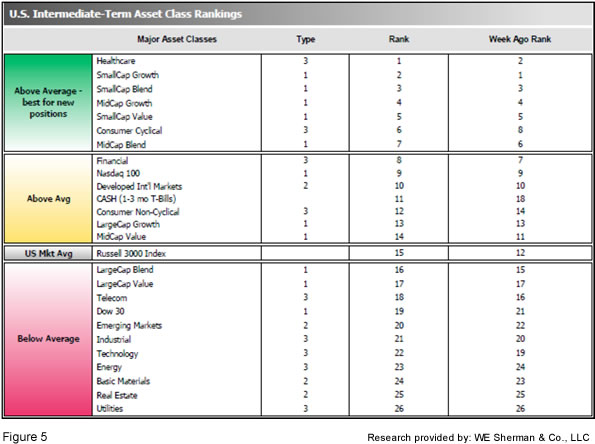
The average ranking of Defensive SHUT sectors fell to 17.3 from the prior week’s 17.0, while the average ranking of Offensive DIME sectors fell to 18.3 from the prior week’s 17.5. The Defensive SHUT sectors are now ranked higher than the Offensive DIME sectors for the first time in a month, returning to the caution that institutional investors have displayed continuously since Q1 of 2014. Note: these are “ranks”, not “scores”, so smaller numbers are higher ranks and larger numbers are lower ranks.
Summary:
The US has led the worldwide recovery, and continues to be among the strongest of global markets. However, the over-arching Secular Bear Market may remain in place globally even as new highs are reached in the US.
Because the world may still be in a Secular Bear, we have no expectations of runs of multiple double-digit consecutive years, and we expect poor market conditions to be a frequent occurrence. Nonetheless, we remain completely open to any eventuality that the market brings, and our strategies, tactics and tools will help us to successfully navigate whatever happens.
Check out the latest article in the Resource area of our website:
“Hacking and Identity Theft: A Simple Step to Better Protect Yourself

