JULY 2015 – Debt Crisis in Greece Took Center Stage
Submitted by The Blakeley Group, Inc. on July 8th, 2015“(Portfolio) Management is, above all, a practice where art, science, and craft meet”
The very big picture:
In the “decades” timeframe, the question of whether we are in a continuing Secular Bear Market that began in 2000 or in a new Secular Bull Market has been the subject of hot debate among economists and market watchers since 2013, when the Dow and S&P 500 exceeded their 2000 and 2007 highs. The Bear proponents point out that the long-term PE ratio (called “CAPE”, for Cyclically-Adjusted Price to Earnings ratio), which has done a historically great job of marking tops and bottoms of Secular Bulls and Secular Bears, did not get down to the single-digit range that has marked the end of Bear Markets for a hundred years, but the Bull proponents say that significantly higher new highs are de-facto evidence of a Secular Bull, regardless of the CAPE. Further confusing the question, the CAPE now has risen to levels that have marked the end of Bull Markets except for times of full-blown market manias. See Fig. 1 for the 100-year view of Secular Bulls and Bears.
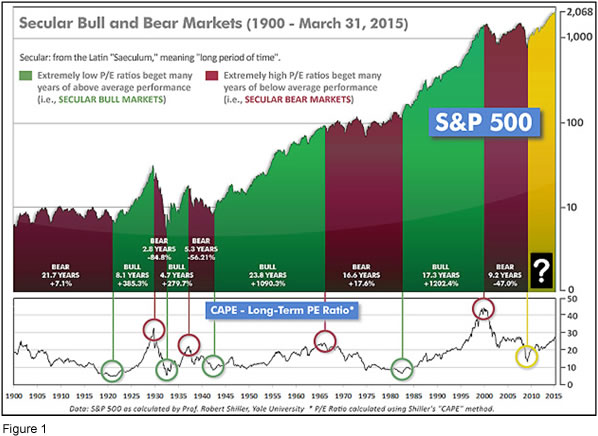
Even if we are in a new Secular Bull Market, market history says future returns are likely to be modest at best. The CAPE is at 26.7, down from the prior week’s 27.0, and approximately at the level reached at the pre-crash high in October, 2007. In fact, since 1881, the average annual returns for all ten year periods that began with a CAPE at this level have been just 3%/yr (see Fig. 2). (Note: all P/E references are to the Shiller P/E values, sometimes called PE10 or CAPE, which are calculated so as to remove shorter-term fluctuations; see robertshiller.com for details).
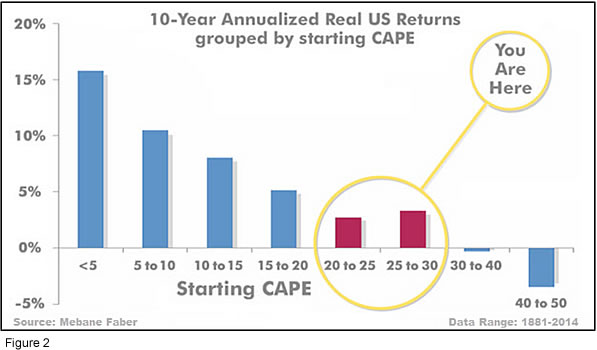
This further means that above-average returns will be much more likely to come from the active management of portfolios than from passive buy-and-hold. Although a mania could come along and cause the CAPE to shoot upward from current levels (such as happened in the late 1920’s and the late 1990’s), in the absence of such a mania, buy-and-hold investors will likely have a long wait until the arrival of returns more typical of a rip-snorting Secular Bull Market.
In the big picture:
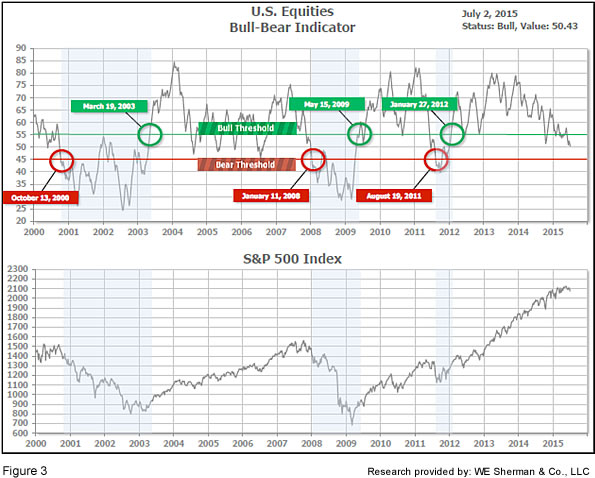
The “big picture” is the months-to-years timeframe – the timeframe in which Cyclical Bulls and Bears operate. The US Bull-Bear Indicator (see Fig. 3) is at 50.4, down from the prior week’s 51.7, and continues in Cyclical Bull territory. The current Cyclical Bull has taken the US and some of Europe to new all-time highs, but many of the world’s major indices have yet to top 2007’s levels – particularly in the Emerging Markets area.
In the intermediate picture:
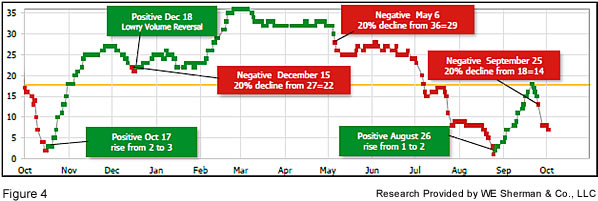
The intermediate (weeks to months) indicator (see Fig. 4) is Positive and ended the week at 23, unchanged from the week’s prior 26. Separately, the quarter-by-quarter indicator – based on domestic and international stock trend status at the start of each quarter – gave a positive indication on the first day of July for the prospects for the fourth quarter of 2015.
Timeframe summary:
In the Secular (years to decades) timeframe (Figs. 1 & 2), whether we are in a new Secular Bull or still in the Secular Bear, the long-term valuation of the market is simply too high to sustain rip-roaring multi-year returns. In the Cyclical (months to years) timeframe (Fig. 3), all major equity markets are in Cyclical Bull territory. In the Intermediate (weeks to months) timeframe (Fig. 4), US equity markets are again rated as Positive. The quarter-by-quarter indicator gave a positive signal for the 3rd quarter: US equities were in an uptrend at the start of Q3 2015, sufficient to signal a higher likelihood of an up quarter than a down quarter.
In the markets:
U.S. stocks were unable to resist the pressure of falling global markets and fell for a second week as the debt crisis in Greece took center stage. Most of the damage occurred on Monday, when the S&P 500 had its largest one-day drop since October of last year. For the week, the Dow Jones Industrial Average dropped 216 points and is now negative for the year down -0.52%. The S&P 500 lost 24 points, or -1.18%, closing at 2076. The tech-heavy Nasdaq lost 71 points, but was still able to hold on to the 5000 level at 5009. MidCaps and SmallCaps, leaders of the US market so far this year, lost -1.75% and -2.46% respectively. Canada’s TSX shed -1.15%, the eighth loss of the last ten weeks.
In commodities, Gold declined $8.50 an ounce to $1165, and silver dropped 10 cents to $15.65. Oil broke out of its consolidation but to the downside, shedding -5.28% to end the week at $56.50 a barrel.
In international markets, Developed International declined -2.68% and Emerging Markets ended down -0.45%. Driven by the twists and turns in the Greek saga, declines in Europe were widespread and significant as London’s FTSE dropped -2.49%, Germany’s DAX dropped ‑3.42%, and France’s CAC dropped -4.42%. In Asia, China’s plunge continues as the market that had ended the week 4 weeks ago at over 5000 now stands at 3912, plunging -6.68% for the week and now well within “Bear Market” territory.
For the month of June, markets were nearly all lower. The exception in the US was the SmallCap Russell 2000, eking out a +0.6% gain. The Dow and the S&P 500 were both lower by -2.1%. The Toronto Composite was off by ‑3.1%, and both Developed International and Emerging International were similarly down by -3% each. Gold and Silver dropped -2.1% and -6.1%, respectively, and oil shed more than -6%.
Second quarter (April, May, June) returns were much more mixed than were June’s. In the US, the Dow and S&P 500 were both lower for the quarter, at -0.23% and -0.88% respectively, but the Nasdaq Composite (+1.75%) and the Russell 2000 (+0.09%) both gained. Canada’s TSX shed -2.34%, Emerging International lost ‑0.54%, but Developed International rose by +0.61% for the quarter. The prize for the wildest ride during the quarter goes to the Shanghai market, which gained a whopping +37% from March 31st to the high of June 12, then gave it all up in less than 3 weeks in a nearly straight plunge into the end of the quarter.
In US economic news, employers added 223,000 jobs in June, in line with estimates. The headline jobless rate fell to 5.3%, a 7-year low. Beneath the headlines however the details weren’t as optimistic–labor force participation rate plunged and wage growth slowed. Small business continued to dominate hiring, now with five straight months of gains over 100,000. In the details, construction and manufacturing both added jobs. Manufacturing ended a 3-month losing streak and added 7000 jobs in June. There were 281,000 initial claims for unemployment in the June 27 week, up 10,000 from the prior week. Continuing claims rose 15,000 to 2.26 million.
Pending home sales reached nine-year highs and scored a fifth straight monthly increase as contract signings rose +0.9% in May, according to the National Association of Realtors. “The steady pace of solid job creation seen now for over a year has given the housing market a boost this spring,” said NAR Chief Economist Lawrence Yun. The index is +10.4% above year ago levels, and has shown year-over-year increases for nine straight months.
Consumer confidence gained almost 6 points to 101.4 nearing the high reached in January. The present situation index rose to 111.6 from 107.1 and the expectations index jumped over 8 points to 94.6.
US Manufacturing improved in June as the Purchasing Managers Index (PMI) was stronger than expected in June at 53.5, a +0.7 point gain from May. The report supports the belief that the economy has moved past its winter weakness and further opens the door for the Federal Reserve to start hiking interest rates as soon as September. However, export orders slipped into contraction below 50 concurrent with the strengthening dollar. Factory orders overall declined -1% in May, falling further from April’s -0.7% decline.
Federal Reserve Vice Chairman Stanley Fischer said that the US consumer is making a comeback and that economic growth is improving. According to Mr. Fisher, “the latest monthly data on real consumption provide welcome evidence that consumer demand is rebounding.” “Our policy will be data dependent, and the FOMC (Federal Open Market Committee) at upcoming meetings will weigh possible adjustments to the level of the target federal funds rate, based on its assessment of incoming data and the economic outlook,” Fischer said. He also noted that the FOMC decided at its June 16-17 meeting not to include time-based guidance about when the policy change is coming.
Economic sentiment in the Eurozone dipped in May according to the European Commission’s survey. Across the Eurozone, the harmonized consumer price index gained +0.2% for the year in June, lower than the +0.3% in May. The unemployment rate for the Eurozone was unchanged at 11.1% in May – Germany had the lowest jobless rate at 4.7%, and Greece, the highest at 25.6%.
Factory PMI in the Eurozone was 52.5 in June according to Markit. France and Germany both showed expansion at 50.7 and 51.9, respectively. Eurozone producer prices fell -2% in May, less than the -2.1% in April but still deflationary.
The European Central Bank will expand its QE program to include state-backed corporate bonds. The amount of debt being issued by sovereign countries remains too low to absorb the banks €60 billion per month program. The ECB had previously stated it would step up bond purchases before liquidity fell during July and August.
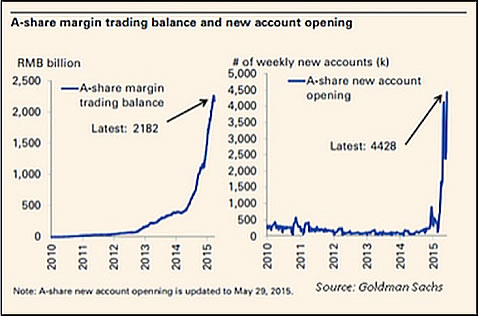
China’s central bank cut interest rates 25 bps last weekend in response to the plunge in its equity market. It was the fourth rate cut since November and it affected two rates. The last time China took such a step was in the financial crisis of 2008. It also eased margin requirements for investors, which seemed puzzling to most outsiders, since runaway use of margin by individual investors was a primary cause of the market’s recent overheating and subsequent bursting. This graphic shows how the use of margin, and the opening of new stock-trading accounts, has skyrocketed in recent months as huge numbers of individual speculators have plunged into the Chinese market.
All during the coverage of the Greek crisis, writers and commentators have frequently used “Eurozone” and “European Union” interchangeably. However, they are not the same. There are 28 member countries in the European Union, but only 19 are users of the Euro currency – i.e., they are members of the “Eurozone”. The 9 members of the European Union who are NOT members of the Eurozone are: United Kingdom, Denmark, Sweden, Poland, Czech Republic, Hungary, Romania, Bulgaria and Croatia. Interestingly, Switzerland, although it is located in the heart of Europe, is neither a member of the European Union nor the Eurozone. This map, from the Washington Post, illustrates the differences.

(sources: Reuters, Barron’s, Wall St Journal, Bloomberg.com, ft.com, guggenheimpartners.com, ritholtz.com, markit.com, financialpost.com, Eurostat, Statistics Canada, Yahoo! Finance, stocksandnews.com, wantchinatimes.com, BBC, 361capital.com, pensionpartners.com; Figs 3-5 source W E Sherman & Co, LLC)
The ranking relationship (shown in Fig. 5) between the defensive SHUT sectors (“S”=Staples [a.k.a. consumer non-cyclical], “H”=Healthcare, “U”=Utilities and “T”=Telecom) and the offensive DIME sectors (“D”=Discretionary [a.k.a. Consumer Cyclical], “I”=Industrial, “M”=Materials, “E”=Energy), is one way to gauge institutional investor sentiment in the market.
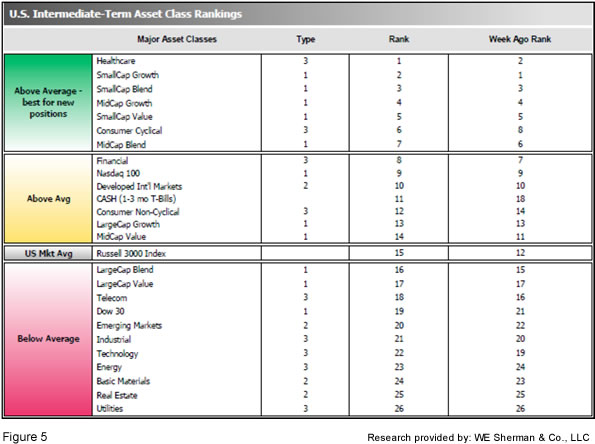
The average ranking of Defensive SHUT sectors fell slightly to 14.3 from the prior week’s 14, while the average ranking of Offensive DIME sectors rose slightly to 18.8 from the prior week’s 18.3. The Defensive SHUT sectors have maintained their lead in rankings over the Offensive DIME sectors. Note: these are “ranks”, not “scores”, so smaller numbers are higher ranks and larger numbers are lower ranks.
Summary:
The US has led the worldwide recovery, and continues to be among the strongest of global markets. However, the over-arching Secular Bear Market may remain in place globally even as new highs are reached in the US.
Because the world may still be in a Secular Bear, we have no expectations of runs of multiple double-digit consecutive years, and we expect poor market conditions to be a frequent occurrence. Nonetheless, we remain completely open to any eventuality that the market brings, and our strategies, tactics and tools will help us to successfully navigate whatever happens.
Check out the latest article in the Resource area of our website:
“Hacking and Identity Theft: A Simple Step to Better Protect Yourself

