January 2016: U.S. Home Prices Rose +5.2% in October
Submitted by The Blakeley Group, Inc. on January 7th, 2016“A long, healthy, and happy life is the result of making a contribution in the world, of having meaningful projects that are personally exciting, and to contribute to and bless the lives of others.”
The very big picture:
In the “decades” timeframe, the question of whether we are in a continuing Secular Bear Market that began in 2000 or in a new Secular Bull Market has been the subject of hot debate among economists and market watchers since 2013, when the Dow and S&P 500 exceeded their 2000 and 2007 highs. The Bear proponents point out that the long-term PE ratio (called “CAPE”, for Cyclically-Adjusted Price to Earnings ratio), which has done a historically great job of marking tops and bottoms of Secular Bulls and Secular Bears, did not get down to the single-digit range that has marked the end of Bear Markets for a hundred years, but the Bull proponents say that significantly higher new highs are de-facto evidence of a Secular Bull, regardless of the CAPE. Further confusing the question, the CAPE now has risen to levels that have marked the end of Bull Markets except for times of full-blown market manias. See Fig. 1 for the 100-year view of Secular Bulls and Bears.
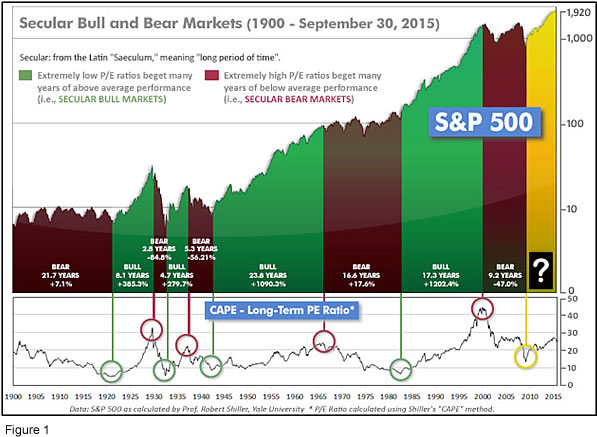
Even if we are in a new Secular Bull Market, market history says future returns are likely to be modest at best. The CAPE is at 25.9, down from the prior week’s 26.1, and approximately at the level reached at the pre-crash high in October, 2007. In fact, since 1881, the average annual returns for all ten year periods that began with a CAPE at this level have been just 3%/yr (see Fig. 2). (Note: all P/E references are to the Shiller P/E values, sometimes called PE10 or CAPE, which are calculated so as to remove shorter-term fluctuations; see robertshiller.com for details).
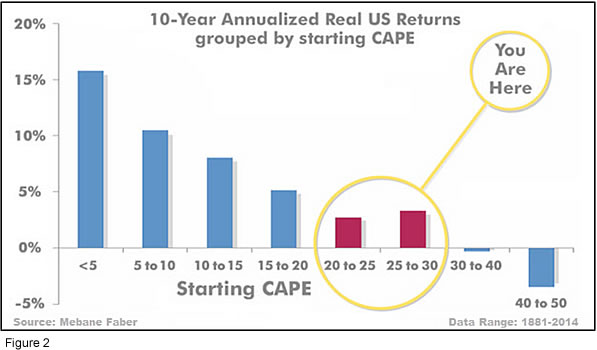
This further means that above-average returns will be much more likely to come from the active management of portfolios than from passive buy-and-hold. Although a mania could come along and cause the CAPE to shoot upward from current levels (such as happened in the late 1920’s and the late 1990’s), in the absence of such a mania, buy-and-hold investors will likely have a long wait until the arrival of returns more typical of a rip-snorting Secular Bull Market.
In the big picture:
The “big picture” is the months-to-years timeframe – the timeframe in which Cyclical Bulls and Bears operate. The US Bull-Bear Indicator (see Fig. 3) is at 57.51, down from the prior week’s 57.70, and continues in Cyclical Bull territory.
In the intermediate picture:
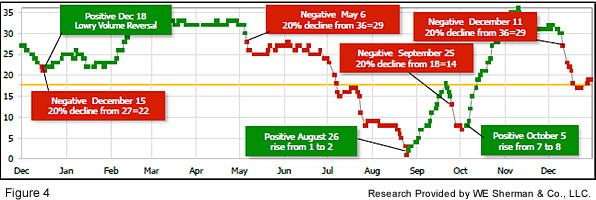
The intermediate (weeks to months) indicator (see Fig. 4) returned negative on Friday, December 11. The indicator ended the week at 32, up from the prior week. Separately, the quarter-by-quarter indicator – based on domestic and international stock trend status at the start of each quarter – gave a negative indication on the first day of January for the prospects for the first quarter of 2016.
Timeframe summary:
In the Secular (years to decades) timeframe (Figs. 1 & 2), whether we are in a new Secular Bull or still in the Secular Bear, the long-term valuation of the market is simply too high to sustain rip-roaring multi-year returns. In the Cyclical (months to years) timeframe (Fig. 3), all major equity markets are in Cyclical Bull territory. In the Intermediate (weeks to months) timeframe (Fig. 4), US equity markets are rated as Negative. The quarter-by-quarter indicator gave a negative signal for the 1st quarter: neither US equities nor ex-US equities were in an uptrend at the start of Q1 2016, sufficient to signal a higher likelihood of a down quarter than an up quarter.
In the markets:
On Thursday, stocks closed the last trading session of 2015 with losses across the board. The Dow Jones Industrial Average lost -0.7% on the week, down -2.23% for the year. The LargeCap S&P 500 retreated ‑0.83% on the week, and finished the year down -0.73%. The S&P 400 MidCap index declined -1.24% last week, and was down -3.71% for the year. The SmallCap Russell 2000 was down -1.63% last week, and was the laggard among US indices for the year, down -5.48%. The lone major US index to finish up for the year was the Nasdaq, which dropped -0.81% on the week, but was up +5.7% for the year. Canada’s TSX lost -2.25% on the week, ending a disappointing year that returned -11.09%.
International markets were mixed for the week. Germany’s DAX was up +0.14%, France’s CAC40 down ‑0.56%, Italy’s Milan FTSE up +1.7%, and the UK’s FTSE down -0.2%. In Asia, China’s Shanghai Stock Exchange was down -2.03%, Japan’s Nikkei was up +0.78%, and Hong Kong’s Hang Seng was down ‑1.01%.
In commodities, precious metals remained under pressure as Gold sold off $15.30 down to $1060.50 an ounce. Silver was down -3.86% and now under $14 to $13.82 an ounce. A barrel of West Texas Intermediate crude oil lost a -$1.05 to $37.07 a barrel.
The month of December was a negative one for all U.S. and almost all international stock indices, but nonetheless ended a positive fourth quarter whose gains all came in the month of October. November was mostly flat, and December negative, but they added up to a decent fourth quarter even though ending with a whimper. For the year, the Nasdaq Composite was up +5.7%, as noted above. The rest of the major US and international equity indexes were negative for the year, with the worst being Emerging Markets, finishing the year at -16.2%. Inside the Emerging Markets group, among the poorest performers was Brazil, at -42% for 2015. Commodities suffered another poor year, with crude oil down almost ‑31%, gold -11%, silver -12% and copper (thought by some to be a harbinger of future global economic activity) -24%.
In U.S. economic news, underlying inflation is either (a) rising to historically-normal levels, or (b) not picking up at all—depending on which data series you look at. The core Consumer Price Index, which removes food and energy prices, increased +0.5% to an annualized 2% last month. However, looking at the Federal Reserve’s favorite price gauge–core personal consumption expenditures, the divergence is the widest it’s been since 2002. Core PCE inflation remained unchanged last month, and at 1.3% annualized. Analysts suggest that as long as the PCE inflation data remains below the 2% Fed target for inflation, policymakers will be cautious hiking rates.
Initial jobless claims rose by 20,000 last week to 287,000, the most since early July—economists had been expecting only 270,000. The smoothed 4-week moving average rose to a 5-month high of 277,000. On a positive note, claims remain near a 4-decade low. The concern in the jobs market has been more about a lack of expansion in hiring through the recovery, rather than people being fired. According to the Labor Department, the U.S. added about 2.5 million jobs in 2015. That figure is acceptable, but 2014 had over 3.1 million jobs added.
U.S. home prices rose +5.2% in October versus a year earlier, according to S&P/Case-Schiller data. It was the fourth straight month of acceleration and the best gain since the summer of 2014. Portland, San Francisco, and Denver led the rankings with 10.9% advances. Economic conditions are supportive of housing demand, but limited inventory is leading to higher prices. But the Commerce Department reported that single-family housing starts rose to an 8-year high last month, so the additional supply is expected to help handle the demand. Pending home sales fell -0.9% in December, the 3rd drop in the last 4 months. The National Association of Realtors attributed the fall to higher home prices and the limited supply of homes. The pending home sales index is up +2.7% versus the previous November, the smallest annual gain since October of 2014.
A surprising drop occurred in the December Chicago Purchasing Managers Index (PMI), which fell deeper into contraction territory, to 42.9 from 48.7 – much worse than the improvement to 50 expected by economists. The -5.8 point drop was the largest contraction since July 2009. Worse, order backlogs plunged -17.2 points to 29.4, which was the worst drop in backlogs since 1951. Nonetheless, 55% of the survey’s respondents reported that they expect strong demand in 2016.
In international economic news, IMF Managing Director Christine Lagarde stated in an article for the German newspaper Handelsblatt that she believes global economic growth will be “disappointing” in 2016. Higher interest rates in the United States and the continuing economic slowdown in China are contributing to a decline in global trade and weak raw materials prices for commodity-producing nations, she said.
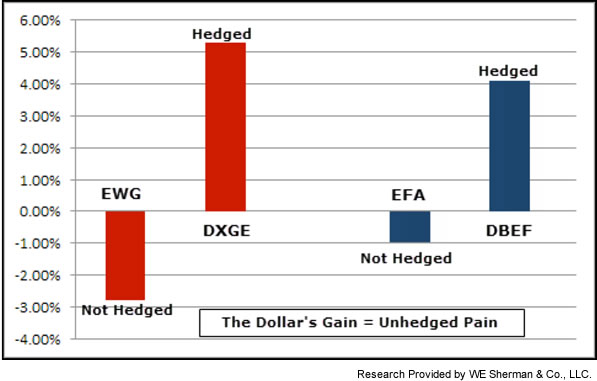
Finally, 2015’s increase in the value of the dollar relative to other global currencies has made a win-or-lose difference in the returns of many popular international investments vehicles.
The vast majority of American investors make their international investments in “unhedged” ETFs and Mutual Funds, where “unhedged” means that there is no attempt to offset (i.e., “hedge”) the effects of the dollar’s ups and downs on the value of the investments.
The dollar gained value in 2015, causing “unhedged” foreign investments to be negatively affected and frequently made the difference between an annual gain or loss for American investors. Here are two examples:
iShares MSCI Germany ETF – unhedged (EWG)
vs
WisdomTree Germany Hedged Equity ETF – hedged (DXGE)
and
iShares MSCI EAFE ETF – unhedged (EFA) (EAFE = Europe, Australia and Far East)
vs
Deutsche X-trackers MSCI EAFE Hedged ETF – hedged (DBEF)
(sources: Reuters, Barron’s, Wall St Journal, Bloomberg.com, ft.com, guggenheimpartners.com, ritholtz.com, markit.com, financialpost.com, Eurostat, Statistics Canada, Yahoo! Finance, stocksandnews.com, marketwatch.com, wantchinatimes.com, BBC, 361capital.com, pensionpartners.com, cnbc.com, FactSet; Figs 3-5 source W E Sherman & Co, LLC)
The ranking relationship (shown in Fig. 5) between the defensive SHUT sectors (“S”=Staples [a.k.a. consumer non-cyclical], “H”=Healthcare, “U”=Utilities and “T”=Telecom) and the offensive DIME sectors (“D”=Discretionary [a.k.a. Consumer Cyclical], “I”=Industrial, “M”=Materials, “E”=Energy), is one way to gauge institutional investor sentiment in the market.
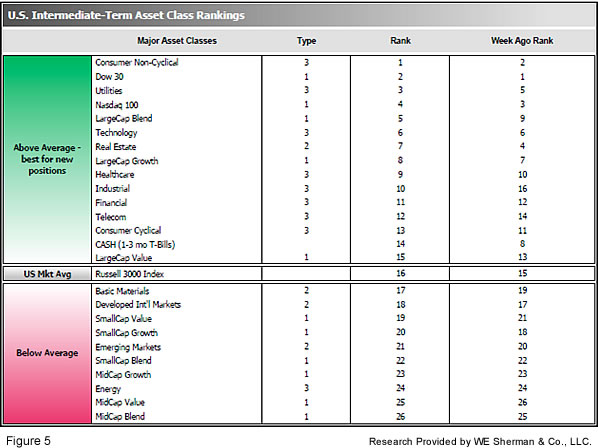
The average ranking of Defensive SHUT sectors rose to 6.3 from the prior week’s 7.8, while the average ranking of Offensive DIME sectors rose to 16.0 from the prior week’s 17.3. The Defensive SHUT sectors have maintained their lead over the Offensive DIME sectors. Note: these are “ranks”, not “scores”, so smaller numbers are higher ranks and larger numbers are lower ranks.
Summary:
The US has led the worldwide recovery, and continues to be among the strongest of global markets. However, the over-arching Secular Bear Market may remain in place globally even through new highs were reached in the US earlier this year. Because the world may still be in a Secular Bear, we have no expectations of runs of multiple double-digit consecutive years, and we expect poor market conditions to be a frequent occurrence. Nonetheless, we remain completely open to any eventuality that the market brings, and our strategies, tactics and tools will help us to successfully navigate whatever happens.
Check out the latest article in the Resource area of our website:
“Hacking and Identity Theft: A Simple Step to Better Protect Yourself

