FEB 2021 Bright Spot for Apple
Submitted by The Blakeley Group, Inc. on February 5th, 2021The very big picture (a historical perspective):
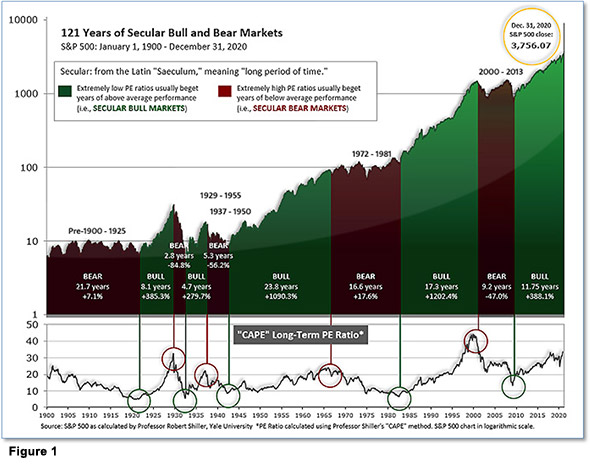
The long-term valuation of the market is commonly measured by the Cyclically Adjusted Price to Earnings ratio, or “CAPE”, which smooths-out shorter-term earnings swings in order to get a longer-term assessment of market valuation. A CAPE level of 30 is considered to be the upper end of the normal range, and the level at which further PE-ratio expansion comes to a halt (meaning that further increases in market prices only occur as a general response to earnings increases, instead of rising “just because”). The market was recently at that level.
Of course, a “mania” could come along and drive prices higher - much higher, even - and for some years to come. Manias occur when valuation no longer seems to matter, and caution is thrown completely to the wind - as buyers rush in to buy first, and ask questions later. Two manias in the last century - the “Roaring Twenties” of the 1920s, and the “Tech Bubble” of the late 1990s - show that the sky is the limit when common sense is overcome by a blind desire to buy. But, of course, the piper must be paid, and the following decade or two were spent in Secular Bear Markets, giving most or all of the mania-gains back.
The Very Big Picture: 120 Years of Secular Bulls and Bears

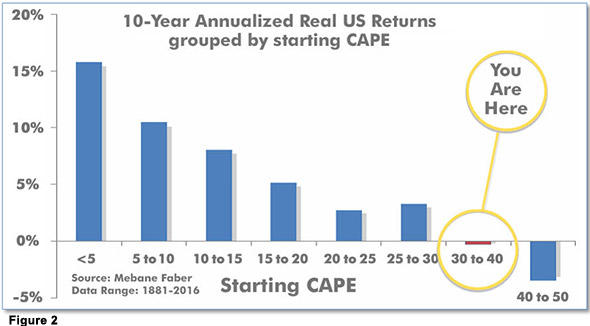
See Fig. 1 for the 100-year view of Secular Bulls and Bears. The CAPE is now at 33.82, down from the prior week’s 34.92. Since 1881, the average annual return for all ten-year periods that began with a CAPE in the 30-40 range has been slightly negative (see Fig. 2).
Note: We do not use CAPE as an official input into our methods. However, if history is any guide - and history is typically ‘some’ kind of guide - it’s always good to simply know where we are on the historic continuum, where that may lead, and what sort of expectations one may wish to hold in order to craft an investment strategy that works in any market ‘season’ … whether current one, or one that may be ‘coming soon’!
The Very Big Picture: Historical CAPE Values
Current reading: 33.82

The big picture:
As a reading of our Bull-Bear Indicator for U.S. Equities (comparative measurements over a rolling one-year timeframe), we remain in Cyclical Bull territory.
The complete picture:
Counting-up of the number of all our indicators that are ‘Up’ for U.S. Equities (see Fig. 3), the current tally is that three of four are Positive, representing a multitude of timeframes (two that can be solely days/weeks, or months+ at a time; another, a quarter at a time; and lastly, the {typically} years-long reading, that being the Cyclical Bull or Bear status).
The Current ‘Complete Picture’: The Sum of Positive Indicators.

In the markets:
U.S. Markets: Stocks declined sharply last week amid much higher volatility and trading volumes. Large caps held up marginally better than mid-cap and small-cap shares. The Dow Jones Industrial Average shed over 1000 points last week closing at 29,983 - a decline of 3.3%. The technology-heavy NASDAQ Composite gave up most of last week’s gains finishing down -3.5%. By market cap, the large cap S&P 500 fell -3.3%, while the mid-cap S&P 400 and small-cap Russell 2000 retreated -5.0% and -4.4% respectively.
International Markets: International markets finished the week in a sea of red. Canada’s TSX fell -2.9% and the United Kingdom’s FTSE 100 retreated -4.3%. On Europe’s mainland, France’s CAC 40 and Germany’s DAX declined ‑2.9% and -3.2%, respectively. In Asia, China’s Shanghai Composite and Japan’s Nikkei each fell -3.4%. As grouped by Morgan Stanley Capital International, developed markets gave up -3.7% while emerging markets fell -4.5%.
Commodities: Precious metals ended the week mixed. Gold ticked down -0.3% to $1850.30 per ounce, while Silver rose 5.3% to $26.91. Oil finished down for a second week. West Texas Intermediate crude closed at $52.20 per barrel, a decline of -0.1%. The industrial metal copper, viewed by some analysts as a barometer of world economic health due to its wide variety of uses, finished the week down -1.9%.
January Summary: For the month of January, the Dow declined -2.0% and the S&P 500 fell -1.1%, while the NASDAQ Composite added 1.4%. Lesser-capitalization issues outperformed, with mid-caps gaining 1.5%, and small-caps gaining 5.0%. Internationally, Canada gave up -0.6% while the UK fell -0.8%. France and Germany declined -2.7% and -2.1%, respectively, while China and Japan rose 0.3% and 0.8%. Emerging markets finished the month up 3.2%, while developed markets ended down -0.8%. Gold gave up -2.4% in January, while Silver rose 1.9%. Oil had a strong January, up 7.6%, and copper added 1.2%.
U.S. Economic News: The number of Americans filing for first-time unemployment benefits dropped to a three-week low despite an uptick in coronavirus cases. The Labor Department reported initial jobless claims fell by 67,000 to a seasonally-adjusted 847,000 last week. Economists had forecast claims to total 875,000. Before the pandemic, new claims were running in the low 200,000s and they had never risen by more than 695,000 in any one week. Meanwhile, the number of people already collecting state jobless benefits declined by 203,000 to a seasonally adjusted 4.77 million. That’s the lowest level since the pandemic began.
Home prices surged at a fast pace yet again in November according to two separate indices released this week. The S&P CoreLogic Case-Shiller 20-city home price index posted a 9.1% year-over-year gain in November - a 1.1% increase from the previous month. On a monthly basis, the index increased 1.5% between October and November. Across the country, the broader Case-Shiller national price index showed a 9.5% gain year-over-year, up 8.4% from the prior month. Prices rose in at least 19 of the 20 large cities tracked by Case-Shiller. Detroit, which is typically included in the 20-city index, was again excluded because of issues collecting data during previous coronavirus-related shutdowns. Phoenix experienced the largest price increase for the 18th consecutive month with a 13.8% year-over-year increase, followed by Seattle (12.7%) and San Diego (12.3%).
Despite rising prices, sales of newly built homes continued to rise in December. The Census Bureau reported new home sales occurred at a seasonally-adjusted annual rate of 842,000 last month. That was a 1.6% increase over November’s reading. Analysts had expected an annual rate of 875,000. Compared to 2019, December’s numbers were up roughly 15% year-over-year. Gains varied by part of the country, led by a 30.6% increase in the Midwest, but sales in the Northeast and South fell on a monthly basis, by 6.1% and 5.1% respectively. Inventory rose slightly to a 4.3-month supply. A six-month supply of homes is generally considered indicative of a balanced market. The median price of new homes for sale was $355,900, up 8% from 2019.
U.S. economic growth slowed to a 4% annual pace at the end of last year as a record wave of coronavirus cases weighed on the recovery. It followed a 33.4% surge in the previous quarter, which reflected the reopening of the economy and massive fiscal and monetary stimulus. But with COVID cases and deaths spiking since the fall, partial shutdowns in some industries and states, and brewing social unrest around the presidential election, the economic recovery lost momentum at yearend. Jim Baird, chief investment officer at Plante Moran Financial Advisors summed it up stating, “The bottom line is that the economy remains in a delicate spot.”
Confidence among the nation’s consumers recovered a bit in January as the number of coronavirus cases and fatalities continued to decline. The Conference Board reported its index of consumer confidence rose 2.2 points to 89.3 this month, after two months of declines. Last month’s reading was the lowest in five months. Economists had forecast a further decline to 88. Other measures of confidence, including the consumer-sentiment survey and daily report by Morning Consult, also recovered in January. Consumer confidence is still far below pre-pandemic levels, however. The index stood at 132.6 before the viral outbreak last February.
Americans continued to cut their spending in December, for the second month. The Commerce Department reported consumer spending declined 0.2% last month. On a positive note, spending didn’t fall as much as expected. Economists had forecast a 0.4% drop. Spending fell the most in December on recreation goods and vehicles, groceries, liquor and services such as dining out. Americans also cut spending on non-essentials. Despite the decline, at least one analyst is optimistic of a rebound in spending in the first quarter of 2021. U.S. economist Andrew Hunter at Capital Economics stated, “The recent wave of virus infections and restrictions on activity ensured that consumption ended last year on a weak note, but there are a number of reasons to expect spending to rebound sharply in the first few months of this year.”
Orders for goods expected to last at least 3 years, so-called “durable goods” rose for an eighth month in a row. Orders rose 0.2% in December, below economists’ estimates, but analysts stated it was still a solid report. The drag stemmed predominantly from a slump in new aircraft orders. Excluding transportation and transportation, core orders rose a fairly robust 0.6%. Orders for new cars and trucks increased 1.4% in the final month of 2020. Auto sales have held up pretty well during the pandemic as car buyers took advantage of ultra-low rates to lock in good deals. Jennifer Lee, senior economist at BMO Capital Markets stated, “This report shows firm upward momentum for business investment as the longest year ever came to an end.”
International Economic News: Despite seven consecutive monthly gains, Canada’s economy appears to have contracted last year according to data from Canada’s national statistics agency. Canada’s economy grew by 0.7% in November, Statistics Canada said. However, despite the increase the result means Canada’s economy was still 3% smaller in November than it was in February. Furthermore, the agency also said its preliminary estimate for December shows growth of 0.3%. For the full year, Statistics Canada’s preliminary estimate shows the economy contracted by 5.1%.
Across the Atlantic, the International Monetary Fund (IMF) downgraded its 2021 growth forecast for the United Kingdom. The IMF slashed 1.4 percentage points off its prediction made last October saying it now expects the UK economy to expand by only 4.5% in 2021. At the same time, it updated its forecast for 2022 and now expects expansion of 5%. The UK suffered one of the sharpest downgrades among advanced economies, behind only Canada and Spain. UK scientists discovered a new strain of COVID-19 in Kent, England, in December. The strain has been found to be up to up to 70% more infectious than previous versions of the virus and was behind soaring infection rates in in the UK. The new strain forced Britain to return to lockdown at the start of January.
On Europe’s mainland, official data showed the French economy contracted much less than expected at the end of 2020. The Eurozone’s second-biggest economy shrank 1.3% in the final three months of last year after France entered a second coronavirus lockdown in October to contain a second wave of infections, the INSEE statistics agency said. The slump, which followed an 18.5% rebound in the third quarter after the first lockdown, was nonetheless better than expectations for a 4% contraction. It also meant that for the whole of 2020, the economy contracted 8.3%, which though France’s worst post-war recession was better than the -11% the government had forecast in its budget plans. INSEE said consumer spending surged 23% in December from the previous month as coronavirus restrictions eased heading into the holiday period.
Robust exports from Europe’s economic powerhouse helped Germany eke out 0.1% growth in the final quarter of last year, Germany’s Federal Statistics Office reported. Goods exports and construction supported the economy while a renewed lockdown at the end of last year hit private consumption. Economists had expected a reading of 0.0%. In the third quarter, the economy grew 8.5%. However, the German government slashed its growth forecast for Europe's largest economy to 3% this year, a sharp downward revision from last autumn's estimate of 4.4%, caused by a second coronavirus lockdown.
In Asia, the gap between the size of the U.S. and Chinese economies shrank by close to $1 trillion USD in 2020 after the U.S. posted its worst economic growth figures since the end of World War 2. The U.S. economy contracted by 3.5% last year, while China posted an annual growth of 2.3%. China’s economy rebounded strongly from the pandemic largely due to higher state investments and exports. China is expected to be the only major economy in the world to have officially grown last year. The current-dollar value gap in gross domestic product (GDP) between the world’s two largest economies was reduced by about US$1 trillion to about US$6 trillion, according to calculations by the South China Morning Post based on official data from 2020 and 2019.
Japan’s industrial output dropped 10.1% in 2020 to its lowest level in seven years, government data showed. The seasonally adjusted index of output at factories and mines stood at 90.9 against the 2015 base of 100, for the lowest reading since comparable data became available in January 2013, reported the Economy, Trade and Industry Ministry. Production fell sharply in the spring of 2020 after the expansion of the COVID-19 pandemic disrupted supply chains, constrained socioeconomic activities and reduced consumer demand. Based on manufacturers polled in a survey, the ministry said it expected output to climb 8.9% in January and fall 0.3% in February.
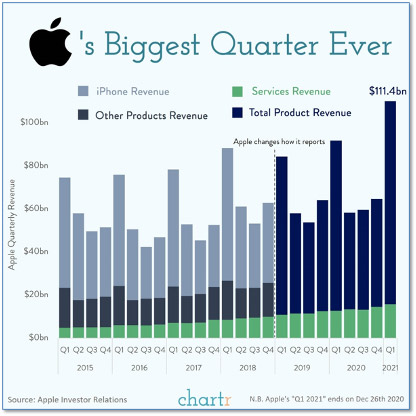
Finally: Amidst all the drama and non-stop news coverage this week surrounding the war between the Reddit WallStreetBets crowd and several hedge funds over GameStop and a handful of other heavily-shorted stocks, Apple posted its biggest quarter ever – and hardly anyone noticed. Apple reported it brought in $111 billion of revenue in the final quarter of 2020. The Services business, which includes Apple Music, the App Store, Apple Pay, Apple TV, iCloud and more, was a bright spot for Apple, growing 24% year-over-year, but it was actually robust sales in China that really helped Apple's revenue over the top to its first-ever $100-billion-plus quarter.

(Sources: All index- and returns-data from Yahoo Finance; news from Reuters, Barron’s, Wall St. Journal, Bloomberg.com, ft.com, guggenheimpartners.com, zerohedge.com, ritholtz.com, markit.com, financialpost.com, Eurostat, Statistics Canada, Yahoo! Finance, stocksandnews.com, marketwatch.com, wantchinatimes.com, BBC, 361capital.com, pensionpartners.com, cnbc.com, CNBC, FactSet.)

