December 2015: It’s Wise for Investors to be Less Blasé
Submitted by The Blakeley Group, Inc. on December 9th, 2015“The gratification of wealth is not found in mere possession or in lavish expenditure, but in its wise application.”
The very big picture:
In the “decades” timeframe, the question of whether we are in a continuing Secular Bear Market that began in 2000 or in a new Secular Bull Market has been the subject of hot debate among economists and market watchers since 2013, when the Dow and S&P 500 exceeded their 2000 and 2007 highs. The Bear proponents point out that the long-term PE ratio (called “CAPE”, for Cyclically-Adjusted Price to Earnings ratio), which has done a historically great job of marking tops and bottoms of Secular Bulls and Secular Bears, did not get down to the single-digit range that has marked the end of Bear Markets for a hundred years, but the Bull proponents say that significantly higher new highs are de-facto evidence of a Secular Bull, regardless of the CAPE. Further confusing the question, the CAPE now has risen to levels that have marked the end of Bull Markets except for times of full-blown market manias. See Fig. 1 for the 100-year view of Secular Bulls and Bears.
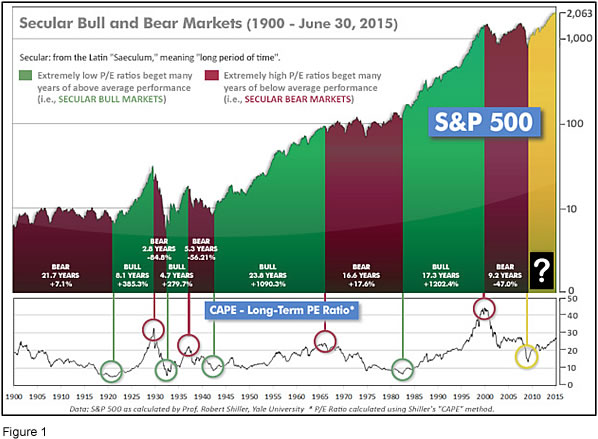
Even if we are in a new Secular Bull Market, market history says future returns are likely to be modest at best. The CAPE is at 26.4, unchanged from the prior week, and approximately at the level reached at the pre-crash high in October, 2007. In fact, since 1881, the average annual returns for all ten year periods that began with a CAPE at this level have been just 3%/yr (see Fig. 2). (Note: all P/E references are to the Shiller P/E values, sometimes called PE10 or CAPE, which are calculated so as to remove shorter-term fluctuations; see robertshiller.com for details).
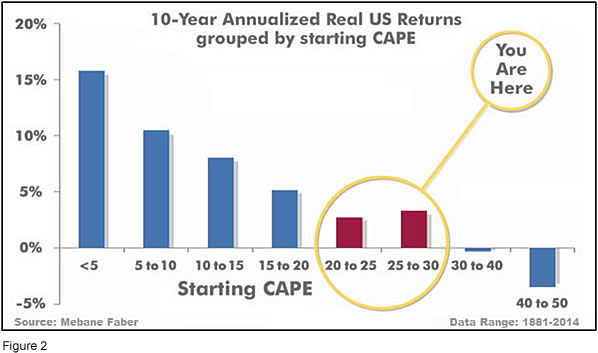
This further means that above-average returns will be much more likely to come from the active management of portfolios than from passive buy-and-hold. Although a mania could come along and cause the CAPE to shoot upward from current levels (such as happened in the late 1920’s and the late 1990’s), in the absence of such a mania, buy-and-hold investors will likely have a long wait until the arrival of returns more typical of a rip-snorting Secular Bull Market.
In the big picture:
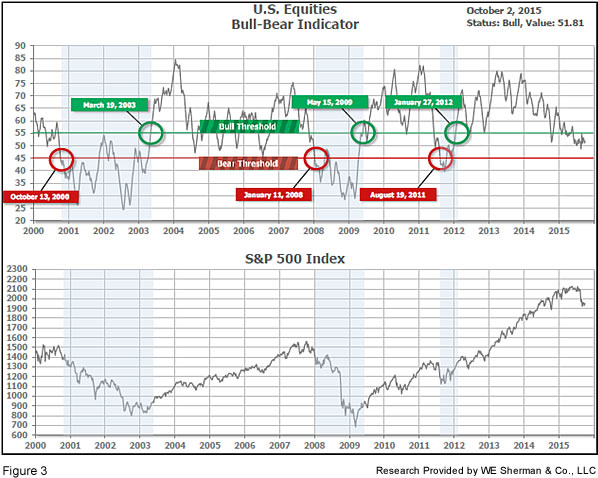
The “big picture” is the months-to-years timeframe – the timeframe in which Cyclical Bulls and Bears operate. The US Bull-Bear Indicator (see Fig. 3) is at 62.71, up from the prior week’s 62.23, and continues in Cyclical Bull territory.
In the intermediate picture:
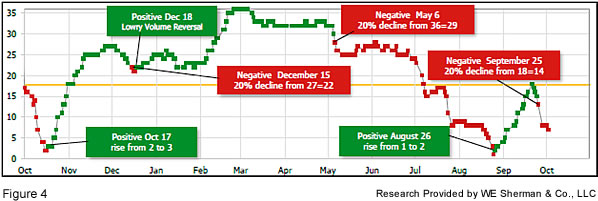
The intermediate (weeks to months) indicator (see Fig. 4) returned to positive on October 5. The indicator ended the week at 32, up from the prior week. Separately, the quarter-by-quarter indicator – based on domestic and international stock trend status at the start of each quarter – gave a negative indication on the first day of October for the prospects for the fourth quarter of 2015.
Timeframe summary:
In the Secular (years to decades) timeframe (Figs. 1 & 2), whether we are in a new Secular Bull or still in the Secular Bear, the long-term valuation of the market is simply too high to sustain rip-roaring multi-year returns. In the Cyclical (months to years) timeframe (Fig. 3), all major equity markets are in Cyclical Bull territory. In the Intermediate (weeks to months) timeframe (Fig. 4), US equity markets are rated as Negative. The quarter-by-quarter indicator gave a negative signal for the 4th quarter: neither US equities nor ex-US equities were in an uptrend at the start of Q4 2015, sufficient to signal a higher likelihood of a down quarter than an up quarter.
In the markets:
A strong rally on Friday moved the major indexes back into positive territory for the week as the closing weekly results hid the underlying intraweek volatility. The Dow Jones Industrials rallied 369 points on Friday to end the week up +49 points (+0.28%) to 17,847. The Nasdaq Composite +14.75 points (+0.29%) to close at 5,142. The Large Cap S&P 500 index remained near flat adding a single point (+0.08%). However, two indexes continue to lag the large caps–the Mid Cap S&P 400 declined -1.35% and the Small Cap Russell 2000 lost -1.58%. Canada’s TSX lost a smidge at -0.07%.
International markets were mixed on the week, with Europe’s major markets jolted to the downside by an unexpectedly unambitious stimulus announcement by the European Central Bank’s Chairman Mario Draghi. Market expectations had been for a much more aggressive stimulus announcement than Draghi delivered. The German DAX led the major indexes to the downside losing over -4.8%. France’s CAC 40 declined -4.37%. The United Kingdom’s FTSE ended the week down -2.15%. Asia and some emerging markets were better as China’s Shanghai Stock Exchange rose +2.58%, Hong Kong’s Hang Seng gained +0.76%, and Brazil moved up by +0.6%.
In commodities, precious metals had strong gains as Silver rose +3.38% to $14.54 an ounce and Gold added $29.70 (+2.8%) to end the week at $1,085.80 an ounce. Oil, however, came under further pressure losing over ‑3.9% to finish at $40.14 for a barrel of West Texas Intermediate crude oil.
For the month of November, US equity markets were flat-to-up, but pretty much everywhere and everything else was down. Hardest hit among global equity markets was Emerging International at -2.52%, and it is no coincidence that commodity markets were really dinged during November, hitting Emerging International equity markets the hardest. Gold was down -6.75% for November, silver -9.19%, and oil -12.5%.
In US economic news, the monthly Non-Farm Payrolls (NFP) report was stronger than expected as the US added 211,000 jobs in November, more than the 190,000 expected. The unemployment rate remained at 5% as the labor force participation rate also moved higher. Construction and retail sectors led the way with a second strong month of hiring. However, manufacturing jobs fell by 1,000. Average hourly earnings rose almost +0.2% last month. The jobs report appears strong enough to give the Federal Reserve the green light to raise interest rates at its next meeting.
Weekly initial jobless claims rose by 9,000 last week to 269,000 according to the Labor Department. Initial claims remain near a 4-decade low. Continuing claims rose by 6000 to 2.16 million in the week ended November 21.
ADP’s private-employer survey showed those employers added 217,300 jobs last month, more than expected. The 204,000 jobs in the service industries accounted for almost all of the gain. Manufacturing jobs showed a very small rise of 6,000, but overall remain down in 2015, which echoes the theme from the NFP of “strong services, weak manufacturing”. Construction employment gains also slowed to 16,000, according to ADPP, roughly half the rate of the prior two months.
Employment firm Challenger, Gray & Christmas reported that employers announced plans to lay off 30,953 workers in November, the lowest since September of last year. Announced plans fell 39% from October and were down 13% versus this time last year. However, year-to-date layoffs of 574,888 make 2015 the worst year for layoffs since 2009. Leading the way is Hewlett-Packard, which plans to cut 30,000 jobs. Oil services firms Schlumberger, Halliburton, and Baker Hughes have all cut tens of thousands of jobs with Schlumberger recently stating that it plans to cut more.
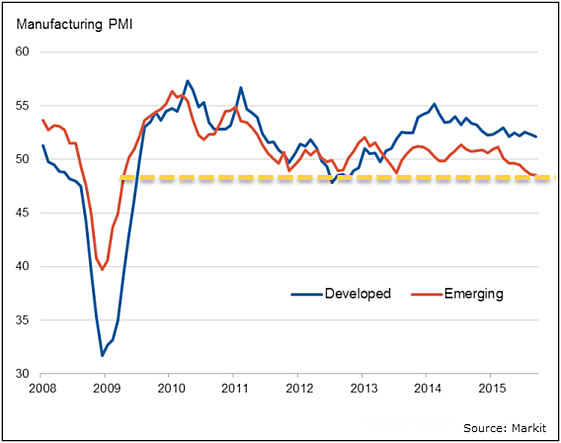
The Chicago-area manufacturing Purchasing Managers Index (PMI) for November missed estimates and fell into contraction at 48.7 (readings below 50 are in contraction territory). November’s reading was a sharp decline from October’s 56.2. Estimates had been for a reading of 54. New orders fell along with backlog orders that showed their 10th straight month of decline. A competing measure, the Institute for Supply Management (ISM) survey, agreed with the PMI, reporting that US manufacturing activity fell into contraction to 48.6 last month, nearly 2 points below the consensus estimate and the lowest level since June 2009. The ISM index had hovered around 50 since September as US manufacturers have been struggling with the impacts of a strong dollar, a slumping oil market, slowdowns in major international economies, and inventory overhang.
By contrast, ISM’s US service-sector index came in at 55.9, indicating that the U.S. service sector still remains in growth mode. However, this is the lowest reading since May, and below expectations.
Federal Reserve Chairwoman Janet Yellen this week again signaled that a December rate hike is likely in testimony before lawmakers after the European Central Bank extended its asset buying program. Yellen stated “U.S. economic growth is likely to be sufficient over the next year or two to result in further improvement in the labor market”, which supports her earlier comments that a rate hike is still likely at the December 15-16 meeting. Yellen stressed, however, that rate hikes would be gradual.
In the Eurozone, the European Central Bank opened its money tap only slightly on Thursday after previously indicating a substantial move would be required to force the economy out of its slump. Instead of expanding its asset purchases beyond the roughly $66 billion per month, the ECB pushed back the purchase program’s earliest end date by 6 months. It left its key lending rate unchanged but the interest paid on assets left overnight at the ECB dropped further into negative territory, from -0.2% to -0.3%. European stocks instantly sold off 2-3% on the news.
October Eurozone consumer prices rose just +0.1% versus a year earlier, below expectations. Core inflation, at 0.9%, also missed views.
In China, the official manufacturing index fell to a 3-year low in November, down -0.2 point to 49.6, according to the National Bureau of Statistics. The reading was slightly below forecasts and pushed further into contraction territory. However, the service sector index rose a half point to 53.6, further evidence that China is rapidly shifting from an export-focused industrial economy to one relying on services and domestic demand. While industrial production and capital spending data have been weak, retail sales growth has remained robust. Apple, Starbucks, and Nike have all shown strong sales growth in China.
Finally, as reported above key gauges of US manufacturing activity have slipped back into contraction territory. Investors, however, still appear to be fixated on the ever rising major market indexes—the Dow Jones Industrials and the S&P 500. Should investors be less blasé about this development? Or can the manufacturing woes be safely ignored? The following chart from economics reporting firm Factset shows that each of the last two big bear markets were preceded by a drop of the ISM manufacturing index into contraction territory, in August of 2000 and December of 2007. Interestingly, each was also preceded by a brief dip into contraction a few months before. The same pattern has now emerged, although the “brief dip” this time was more than a few months ago. Given this history, perhaps investors would be wise to be less blasé.
(sources: Reuters, Barron’s, Wall St Journal, Bloomberg.com, ft.com, guggenheimpartners.com, ritholtz.com, markit.com, financialpost.com, Eurostat, Statistics Canada, Yahoo! Finance, stocksandnews.com, marketwatch.com, wantchinatimes.com, BBC, 361capital.com, pensionpartners.com, cnbc.com, Charles Schwab & Co,; Figs 3-5 source W E Sherman & Co, LLC)
The ranking relationship (shown in Fig. 5) between the defensive SHUT sectors (“S”=Staples [a.k.a. consumer non-cyclical], “H”=Healthcare, “U”=Utilities and “T”=Telecom) and the offensive DIME sectors (“D”=Discretionary [a.k.a. Consumer Cyclical], “I”=Industrial, “M”=Materials, “E”=Energy), is one way to gauge institutional investor sentiment in the market.
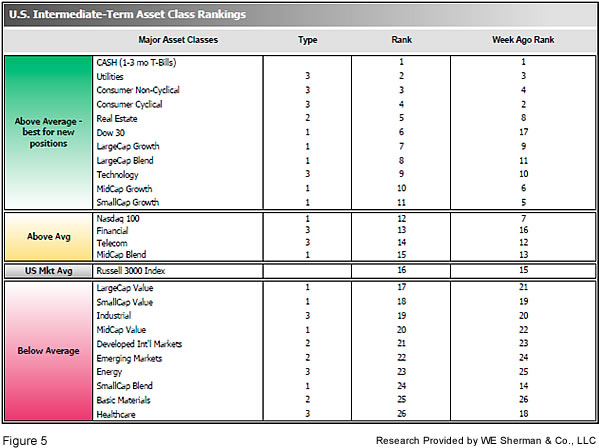
The average ranking of Defensive SHUT sectors slipped to 17.8 from the prior week’s 17.0, while the average ranking of Offensive DIME sectors fell to 14.0 from the prior week’s 11.3. The Offensive DIME sectors continue to lead the Defensive SHUT sectors. Note: these are “ranks”, not “scores”, so smaller numbers are higher ranks and larger numbers are lower ranks.
Summary:
The US has led the worldwide recovery, and continues to be among the strongest of global markets. However, the over-arching Secular Bear Market may remain in place globally even through new highs were reached in the US earlier this year. Because the world may still be in a Secular Bear, we have no expectations of runs of multiple double-digit consecutive years, and we expect poor market conditions to be a frequent occurrence. Nonetheless, we remain completely open to any eventuality that the market brings, and our strategies, tactics and tools will help us to successfully navigate whatever happens.
Check out the latest article in the Resource area of our website:
“Hacking and Identity Theft: A Simple Step to Better Protect Yourself“

