DEC 2020 U.S. Stocks Reached Record Territory
Submitted by The Blakeley Group, Inc. on January 6th, 2021The very big picture (a historical perspective):
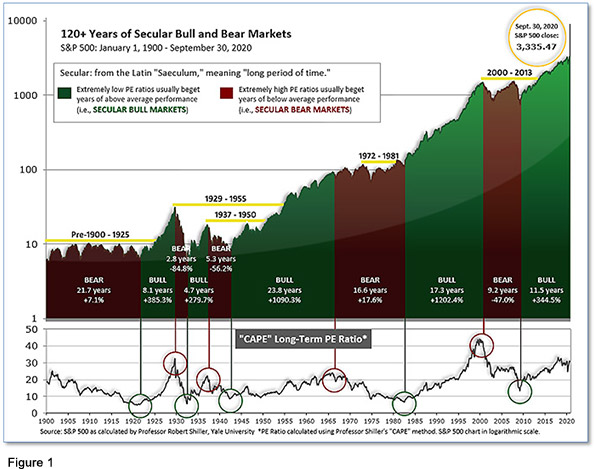
The long-term valuation of the market is commonly measured by the Cyclically Adjusted Price to Earnings ratio, or “CAPE”, which smooths-out shorter-term earnings swings in order to get a longer-term assessment of market valuation. A CAPE level of 30 is considered to be the upper end of the normal range, and the level at which further PE-ratio expansion comes to a halt (meaning that further increases in market prices only occur as a general response to earnings increases, instead of rising “just because”). The market was recently at that level.
Of course, a “mania” could come along and drive prices higher - much higher, even - and for some years to come. Manias occur when valuation no longer seems to matter, and caution is thrown completely to the wind - as buyers rush in to buy first, and ask questions later. Two manias in the last century - the “Roaring Twenties” of the 1920s, and the “Tech Bubble” of the late 1990s - show that the sky is the limit when common sense is overcome by a blind desire to buy. But, of course, the piper must be paid, and the following decade or two were spent in Secular Bear Markets, giving most or all of the mania-gains back.
The Very Big Picture: 120 Years of Secular Bulls and Bears.

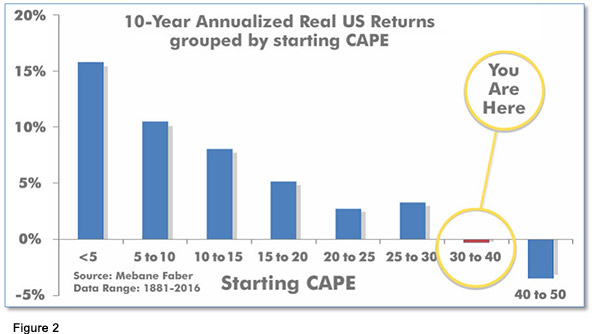
See Fig. 1 for the 100-year view of Secular Bulls and Bears. The CAPE is now at 30.68, up from the prior week’s 31.47. Since 1881, the average annual return for all ten-year periods that began with a CAPE in the 20-35 range have been slightly-positive to slightly-negative (see Fig. 2).
Note: We do not use CAPE as an official input into our methods. However, if history is any guide - and history is typically ‘some’ kind of guide - it’s always good to simply know where we are on the historic continuum, where that may lead, and what sort of expectations one may wish to hold in order to craft an investment strategy that works in any market ‘season’ … whether current one, or one that may be ‘coming soon’!
The Very Big Picture: Historical CAPE Values.
Current reading: 33.79

The big picture:
As a reading of our Bull-Bear Indicator for U.S. Equities (comparative measurements over a rolling one-year timeframe), we remain in Cyclical Bull territory.
The complete picture:
Counting-up of the number of all our indicators that are ‘Up’ for U.S. Equities (see Fig. 3), the current tally is that three of four are Positive, representing a multitude of timeframes (two that can be solely days/weeks, or months+ at a time; another, a quarter at a time; and lastly, the {typically} years-long reading, that being the Cyclical Bull or Bear status).
The Current ‘Complete Picture’: The Sum of Positive Indicators.

In the markets:
U.S. Markets: U.S. stocks reached further into record territory with all of the major benchmarks touching new intraday highs by Friday. The Dow Jones Industrial Average cleared 30,000 points ending the week at 30,218, up 1.0%. The technology-heavy NASDAQ Composite had its third consecutive week of gains adding 2.1%. By market cap, the large cap S&P 500 gained 1.7%, while the mid cap S&P 400 and small cap Russell 2000 rose 1.8% and 2.0%, respectively.
International Markets: International markets were mostly positive for the week. Canada’s TSX rose for a fourth consecutive week adding 0.7%, while across the Atlantic the United Kingdom’s FTSE 100 rallied 2.9%. On Europe’s mainland, France’s CAC 40 gained 0.2%, but Germany’s DAX retreated -0.3%. In Asia, China’s Shanghai Composite and Japan’s Nikkei rose 1.1% and 0.4%, respectively. As grouped by Morgan Stanley Capital International, developed markets added 1.2% while emerging markets rose 1.6%.
Commodities: After three consecutive down weeks, Gold managed to finish to the upside rising 2.9% to $1840 per ounce. Similarly, silver surged 7.1% to $24.25 per ounce. Crude oil rose for a fifth straight week, up 1.6% to $46.26 per barrel. The industrial metal copper, viewed by some analysts as a barometer of world economic health due to its wide variety of uses, also rose for a fifth consecutive week adding 3.1%.
November Summary: The Dow Jones Industrial Average had its best monthly performance since 1987 in November, while the small cap Russell 2000, jumping 18.4%, registered its best monthly gain since its inception in 1978 . Both the Dow and NASDAQ surged 11.8% last month, while the S&P 500 and S&P 400 gained 10.8% and 14.2%, respectively. All major international markets finished the month of November with notable gains. Canada’s TSX added 10.3%, the UK’s FTSE 12.4%, and France and Germany rose 20.1% and 15.0%, respectively. China was the laggard with a 5.2% gain, while Japan’s Nikkei rallied 15.0%. Developed international markets finished the month up 14.3%, while emerging markets added 8.9%. Gold and silver retreated -5.3% and -4.5%, respectively, in November while oil surged a whopping 26.7% and copper gained 12.7%.
U.S. Economic News: The number of Americans filing first-time unemployment benefits fell last week, but overall layoffs remained stubbornly high. The Labor Department reported initial jobless claims dropped a seasonally-adjusted 75,000 to 712,000 in the seven days ended November 28. Economists had forecast claims to total 780,000. Though welcome, the latest decline is unlikely to dispel worries about rising layoffs and a slowdown in hiring following a resurgence of coronavirus cases. Analysts noted another 288,701 people applied for benefits through a temporary federal relief program. The combined number of new state and federal jobless claims still hasn’t dropped below 1 million a week since the start of the pandemic more than eight months ago.
The pace of hiring slowed in November as COVID cases increased. The Bureau of Labor Statistics reported non-farm payrolls rose by 245,000, far below the consensus of 440,000. The unemployment rate declined 0.2% to 6.7%, matching the consensus. Private payrolls had their smallest gain in the past seven months, increasing by 344,000. A full labor market recovery remains a long way off. To date, the labor market has recovered about 60% of the private sector jobs that were lost in March and April.
A measure of housing demand fell further in October as higher prices continued to discourage would-be buyers. The National Association of Realtors (NAR) reported its index of pending home sales dropped 1.1% in its latest reading, following a 2.2% decline in September. The South was the only major region to post an increase, though just barely. Pending home sales posted their biggest decline in the Northeast. Record low mortgage rates and an increase in migration out of major cities have boosted home sales during the pandemic making the housing market a surprising bright spot for the economy. However, the spike in demand has pushed up prices discouraging potential buyers. Lawrence Yun NAR’s chief economist, “The housing market is still hot, but we may be starting to see rising home prices hurting affordability.”
The vast services side of the U.S. economy expanded at its strongest pace in more than five years according to data analytics firm Markit. IHS Markit reported its Services Purchasing Managers’ Index (PMI) jumped 2.5 points to 58.4 last month. Chris Williamson, Chief Business Economist at IHS Markit stated, “November saw US business activity surge higher at a rate not seen since early-2015 as companies enjoyed sharply rising demand for goods and services.” Williamson noted confidence had picked up considerably with encouraging news on vaccines and significantly reduced political uncertainty following the presidential election.
Manufacturing activity expanded in November for the seventh month in a row, but a re-emergence of coronavirus shuttered some plants and led to the loss of some workers. The Institute for Supply Management (ISM) said its manufacturing index fell to 57.5% in November from an almost two-year high of 59.3% in the prior month. Economists had expected a reading of 58%. Although readings over 50% indicate growth, companies encountered more struggles in November with worker absenteeism, temporary plant closures, and an inability to fill open jobs.
Business conditions in the Windy City slowed for a second consecutive month in November, suggesting the record increase in coronavirus cases may be weighing on the economy. The Institute for Supply Management reported its Purchasing Managers Index for Chicago dropped 2.9 points to 58.2 last month. Wall Street economists had forecast the index would drop to just 59. Although readings above 50 indicate expanding conditions, the index sits at a three-month low. Despite the positive readings, business conditions still haven’t returned to normal.
The Federal Reserve’s ‘Beige Book’, a collection of anecdotal information from each of the Federal Reserve’s member banks, showed several regions of the country are experiencing little or no economic growth. The Philadelphia Fed and three of the four Fed banks in the Midwest found that economic activity in their regions showed “little or no growth.” While still positive, business contacts said their optimism has waned as the pandemic spread rapidly across the country. The sharp rise in COVID-19 cases sparked labor supply problems, including absenteeism and attrition, the survey found. Many districts said they fear employment levels would fall over the winter before recovering.
International Economic News: Canada unveiled its largest economic relief package since World War 2 this week. Canada’s Finance Minister Chrystia Freeland announced the federal government will spend $100 billion Canadian dollars to kick start the country’s post-pandemic economy. The spending will bring the deficit to a historic C$381.6bn by March 2021. The wide-ranging plan includes targeted relief for hard-hit business sectors, investments in long-term care homes and distribution of a Covid-19 vaccine. "When the virus is under control and our economy is ready for new growth, we will employ an ambitious stimulus package," to be spent over the next three years Ms. Freeland said in the House of Commons. The spending will amount to 3-4% of Canada's GDP.
A senior British minister said a no-trade deal Brexit is still possible as talks with the European Union stalled on fishing rights in UK waters, ensuring fair competition for companies, and dispute resolution. With less than 30 days left to go before Britain leaves the European Union the two sides are trying to agree on a trade deal that governs nearly $1 trillion in annual trade. In a move that could further undermine the talks, the British government said that, despite EU protests, parliament would press ahead with draft laws next week that would breach London’s earlier divorce treaty with the bloc.
On Europe’s mainland, French national statistics institute INSEE stated the Eurozone’s second-largest economy will contract by 4.5% in the fourth quarter. "After a strong, partly mechanical rebound in the third quarter, French economic activity should fall again during a partially confined fourth quarter," it said. France’s economy had rebounded 18.7% in the third quarter. On Oct. 30, in order to contain a second epidemic wave, the French government ordered the closure of all non-essential businesses. INSEE noted that the economic fallout of the second lockdown is likely to be less severe than the first two-month confinement introduced in mid-March.
German Chancellor Angela Merkel urged citizens to be careful or risk a third wave of the novel coronavirus. Germany’s number of new infections has stabilized at a high level since a partial lockdown was imposed on Nov 2 to contain a second wave of coronavirus infections. But officials have said that progress was still fragile. “We’ll have to be very, very careful during the winter,” Merkel said in a virtual panel discussion with police officers. Merkel also spoke against plans of some regional governments to let hotels open for family visits over Christmas, warning it risked worsening the coronavirus surge sweeping Germany.
In its latest economic outlook the Organization for Economic Cooperation and Development (OECD) said the economic recovery in the global economy would be uneven across countries “potentially leading to lasting changes in the world economy.” It said China was expected to account for over one-third of world economic growth in 2021, while the contribution of Europe and North America “will remain smaller than their weight in the world economy.” The OECD said it sees China, which started recovering earlier than its peers, recording economic growth of 1.8% this year. It remains the only major economy expected to record economic growth in 2020. The world’s second-largest economy was projected to record real GDP growth of 8% next year and 4.9% in 2022.
Japan’s new economic package will include increased subsidies for medical institutions to help them secure more beds for coronavirus patients, a draft of the new government stimulus showed. The government plans to extend its financial aid to companies maintaining employment despite worsening business conditions for two months beyond December, with the daily payment of up to 15,000 yen per employee remaining unchanged. It will also raise the amount of subsidies for local governments which can be used to assist restaurants that shorten operating hours. To finance the additional measures, the government is planning to draft a third supplementary budget totaling 20 trillion yen ($190 billion) for the current fiscal year to March, according to senior officials.
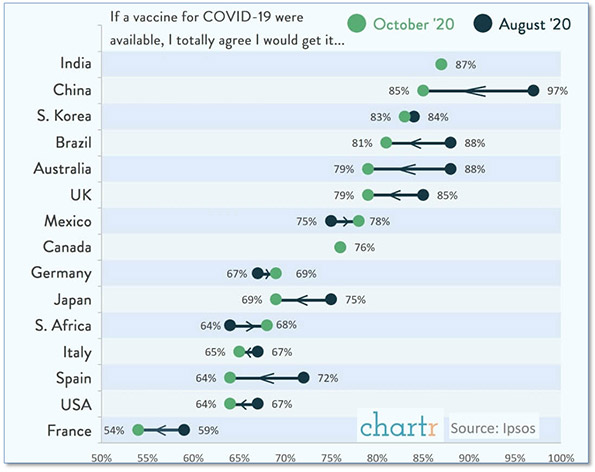
Finally: If a vaccine for COVID-19 were available right now, would you get it? If you aren’t quite sure, you’re not alone—more than a third of Americans stated the same thing. Analytics firm Ipsos looked at survey data from around the world and found that western Europeans and Americans were the least likely to jump at the chance to get a vaccine—about 65%, with the French population being the most skeptical at just 54%. In contrast, India and China led the way with the percentage of people ready to get the vaccine right now. Over 85% of Chinese and 87% of Indians were ready to roll up their sleeves at the first opportunity. A curious feature of the data is that most countries exhibited a decrease in the number of citizens eager to get vaccinated between surveys taken in August and again in November. (Data from Ipsos, chart from chartr.co)

(Sources: All index- and returns-data from Yahoo Finance; news from Reuters, Barron’s, Wall St. Journal, Bloomberg.com, ft.com, guggenheimpartners.com, zerohedge.com, ritholtz.com, markit.com, financialpost.com, Eurostat, Statistics Canada, Yahoo! Finance, stocksandnews.com, marketwatch.com, wantchinatimes.com, BBC, 361capital.com, pensionpartners.com, cnbc.com, CNBC, FactSet.)

