August 2015 – The Economic Impact of Skyrocketing Rents
Submitted by The Blakeley Group, Inc. on August 12th, 2015“Never confuse movement with action or action with movement.”
The very big picture:
In the “decades” timeframe, the question of whether we are in a continuing Secular Bear Market that began in 2000 or in a new Secular Bull Market has been the subject of hot debate among economists and market watchers since 2013, when the Dow and S&P 500 exceeded their 2000 and 2007 highs. The Bear proponents point out that the long-term PE ratio (called “CAPE”, for Cyclically-Adjusted Price to Earnings ratio), which has done a historically great job of marking tops and bottoms of Secular Bulls and Secular Bears, did not get down to the single-digit range that has marked the end of Bear Markets for a hundred years, but the Bull proponents say that significantly higher new highs are de-facto evidence of a Secular Bull, regardless of the CAPE. Further confusing the question, the CAPE now has risen to levels that have marked the end of Bull Markets except for times of full-blown market manias. See Fig. 1 for the 100-year view of Secular Bulls and Bears.
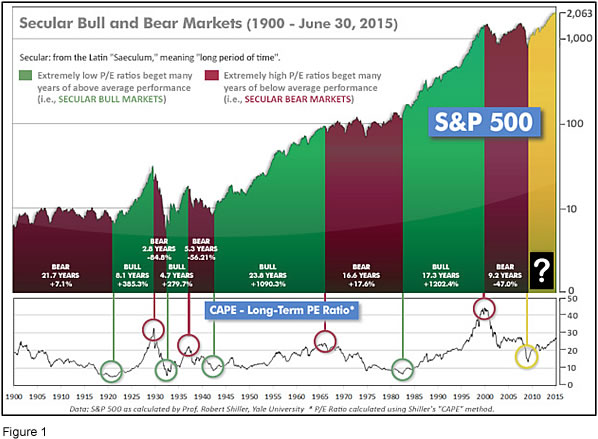
Even if we are in a new Secular Bull Market, market history says future returns are likely to be modest at best. The CAPE is at 26.7, unchanged from the prior week, and approximately at the level reached at the pre-crash high in October, 2007. In fact, since 1881, the average annual returns for all ten year periods that began with a CAPE at this level have been just 3%/yr (see Fig. 2). (Note: all P/E references are to the Shiller P/E values, sometimes called PE10 or CAPE, which are calculated so as to remove shorter-term fluctuations; see robertshiller.com for details).
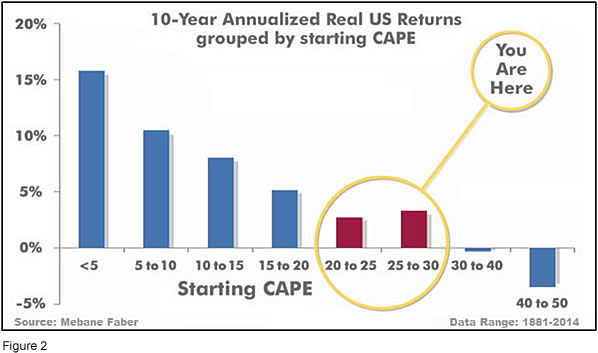
This further means that above-average returns will be much more likely to come from the active management of portfolios than from passive buy-and-hold. Although a mania could come along and cause the CAPE to shoot upward from current levels (such as happened in the late 1920’s and the late 1990’s), in the absence of such a mania, buy-and-hold investors will likely have a long wait until the arrival of returns more typical of a rip-snorting Secular Bull Market.
In the big picture:
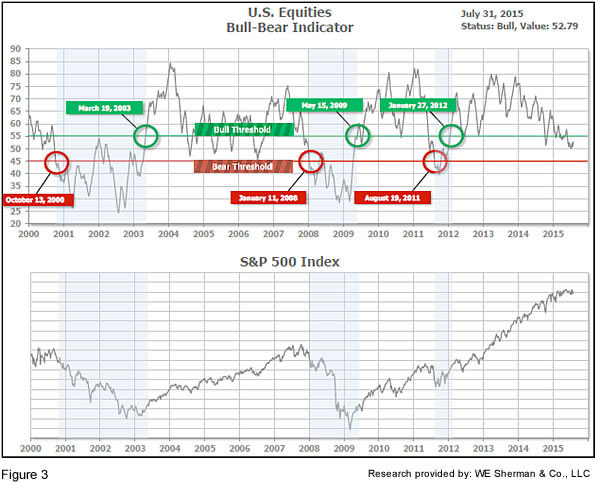
The “big picture” is the months-to-years timeframe – the timeframe in which Cyclical Bulls and Bears operate. The US Bull-Bear Indicator (see Fig. 3) is at 52.79, up from the prior week’s 50.81, and continues in Cyclical Bull territory. The current Cyclical Bull has taken the US and some of Europe to new all-time highs, but many of the world’s major indices have yet to top 2007’s levels – particularly in the Emerging Markets area.
In the intermediate picture:
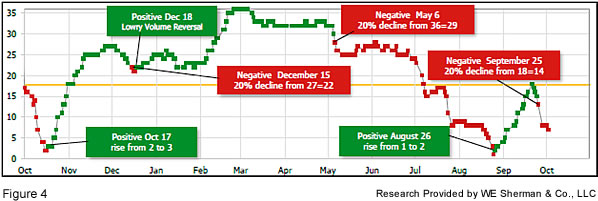
The intermediate (weeks to months) indicator (see Fig. 4) is Positive and ended the week at 9, down from the prior week’s 11. Separately, the quarter-by-quarter indicator – based on domestic and international stock trend status at the start of each quarter – gave a positive indication on the first day of July for the prospects for the fourth quarter of 2015.
Timeframe summary:
In the Secular (years to decades) timeframe (Figs. 1 & 2), whether we are in a new Secular Bull or still in the Secular Bear, the long-term valuation of the market is simply too high to sustain rip-roaring multi-year returns. In the Cyclical (months to years) timeframe (Fig. 3), all major equity markets are in Cyclical Bull territory. In the Intermediate (weeks to months) timeframe (Fig. 4), US equity markets are again rated as Positive. The quarter-by-quarter indicator gave a positive signal for the 3rd quarter: US equities were in an uptrend at the start of Q3 2015, sufficient to signal a higher likelihood of an up quarter than a down quarter.
In the markets:
After a poor start to the week, stocks reversed course and ended the week higher. Midcap stocks (up +1.77% for the week) led small caps (up +1.03%), while the Dow Jones Industrial Average remained the only major index in negative territory for the year, up 121 points to 17689 on the week. The NASDAQ maintained its solid hold above 5000 at 5128, up +0.78%. Previously beaten-down Dow Transports and Dow Utilities were big outperformers for the week, up +3.96% and +3.77% respectively. Canada’s TSX gained +1.99%, despite the continuing declines in oil and gold.
European markets were mixed: Germany’s DAX declined -0.34%, while France’s CAC40 gained +0.5%. Spain showed improved economic numbers but still declined -1.14%. The United Kingdom’s FTSE gained +1.77%.
In commodities, Gold continued its decline for the 6th straight week, losing -$3.40 to $1095 an ounce. Silver was able to halt its 5 week decline and gain +0.34% ending the week at $14.76 an ounce. Oil, like Gold, also continued its decline, down -2.48% for the week to $46.77/barrel for West Texas Intermediate.
The month of July was positive for US stock indices overall, although the SmallCap Russell 2000 index fell -1.22%. The S&P 500 gained +1.97%, and the best performing US index was the Nasdaq Composite at +2.84%. Canada’s TSX fell in July by -0.58%, but the real losers in global indices were to be found in Emerging Markets, paced by China’s huge -15% loss in July (the worst monthly drop in 6 years), with Brazil close behind at -12.45%. The Emerging Market index shed -6.31% overall. Nonetheless, Developed International markets overall traded higher in July, with the Developed International index gaining +2.03%.
In US economic news, the second quarter’s initial GDP reading reported that the economy had expanded at a 2.3% quarterly rate, whereas economists had expected a 2.9% increase. First quarter GDP was also revised up to +0.6% from the previous -0.2% decline. However, the government’s revisions of GDP calculations for 2012-2014 were all downward, to an average growth of 2% versus the previously reported 2.3%. This makes the current economic expansion the weakest since World War 2.
Home prices increased, but at a slower rate according to S&P/Case-Shiller’s 20 city index, which came in at a +4.9% annual gain in May vs expectations of a +5.6% gain. All 20 cities in the index showed a year over year increase. The 20 city index remains 14% below its 2005 peak. The industry hopes that the slower pace of price appreciation could give first-time buyers a better entry point into the market.
New durable goods orders rose +3.4% in June, beating expectations of a +3.1% gain. However, most of the rise was attributed to orders written at the Paris Air Show. Excluding the volatile transportation sector, orders rose just +0.8% – but even that was stronger than expected.
Consumer confidence dropped nearly 9 points to 90.9 in July–a 10 month low. There was broad weakness across the entire report. The expectations gauge fell almost 13 points to 79.9, a level indicating a particularly poor outlook. Also declining was the University of Michigan’s consumer confidence gauge, down -0.2 to 93.1 for its final July reading, and missing expectations for a reading above 94.
The Federal Open Market Committee released a statement on Wednesday stating “the labor market continued to improve, with solid job gains and declining unemployment.” Federal Reserve policymakers said they continued to move closer to ending an unprecedented period of near-zero interest rates, but without providing a clear signal on the timing of liftoff. Chairwoman Janet Yellen is guiding the Fed toward its first rate increase in almost a decade. She said the Fed is likely to tighten this year if the economy continues to improve as she expects. A rate hike may come as soon as September—economists surveyed last week assessed the odds of a rate increase in September at around 50%.
In Canada, C.D. Howe, the business cycle group based in Toronto, stated that Canada was not in a recession. The economy has been weighed down by the plunge in oil prices which had prompted two interest rate cuts in 2015, “but the labor market remains strong” according to the group.
In the Eurozone, bank lending to businesses rose by €3 billion in June, a 33% increase over May and April. Loans to households were up by €15 billion, also greater than the €10 billion rise in May. The EU Commission’s economic sentiment index rose half a point to 104.0 in July—expectations had been for a slight decrease. France and Germany saw the biggest sentiment gains. Inflation expectations fell to the lowest since February. Unemployment remains stubbornly high across the Eurozone: the unemployment rate remained unchanged at 11.1% in June, and youth unemployment rose to 22.5%.
German business confidence improved to 108 from 107.5, beating expectations of a decrease. The current conditions gauge improved to 113.9, also, beating forecasts. German manufacturing continued to show relative strength over construction and retail. German inflation remained tame with the CPI rising 0.2%. The yearly rise was also 0.2%. Finally, German joblessness rose by 9000 in July, the biggest jump in over a year. The unemployment rate remained 6.4%.
Spain’s economy grew 1% in the second quarter. Spain is on track to expand more than 3% this year, much better than most other Eurozone countries. Real output increased +3.1% versus a year ago, the best increase in 8 years.
In Japan, retail sales increased +0.9% for the year in June, the third straight month of year over year increase, although only half of the retail categories showed gains. Industrial production also increased in June, up +0.8%, handily beating expectations of a +0.3% gain.
Finally, a recent study by Pew Research focused on the rising number of millennials living at home. “The Great Recession seems to have hit millennials particularly hard, making it even more difficult for young people to find good jobs and to establish their own households,” the study observes. However, economic numbers for millennials have been improving. The unemployment rate has been heading lower since peaking in 2010 and now stands at 7.7%. Wages have also been slowly creeping up. But the % of millennials living at home has actually increased even while more millennials find better-paying employment.
The US has not reached the level of, say, Italy, where the phenomenon of adult children living at home – particularly males – has spawned the use of two words in the Italian language to describe them: “mammino” (mama’s boy) and “bamboccioni” (big babies).
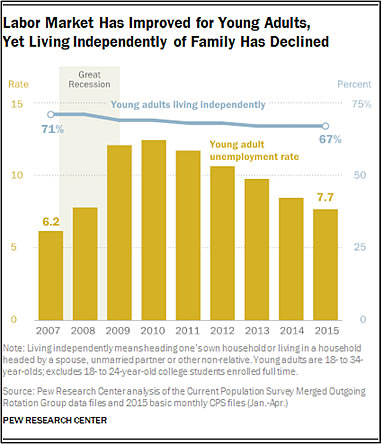
One other big factor could be at play here: the skyrocketing cost of rent. Several major cities across the country are reporting significant percentage increases in rent, some in the double digits. From real estate website Zillow:

(sources: Reuters, Barron’s, Wall St Journal, Bloomberg.com, ft.com, guggenheimpartners.com, ritholtz.com, markit.com, financialpost.com, Eurostat, Statistics Canada, Yahoo! Finance, stocksandnews.com, wantchinatimes.com, BBC, 361capital.com, pensionpartners.com; Figs 3-5 source W E Sherman & Co, LLC)
The ranking relationship (shown in Fig. 5) between the defensive SHUT sectors (“S”=Staples [a.k.a. consumer non-cyclical], “H”=Healthcare, “U”=Utilities and “T”=Telecom) and the offensive DIME sectors (“D”=Discretionary [a.k.a. Consumer Cyclical], “I”=Industrial, “M”=Materials, “E”=Energy), is one way to gauge institutional investor sentiment in the market.
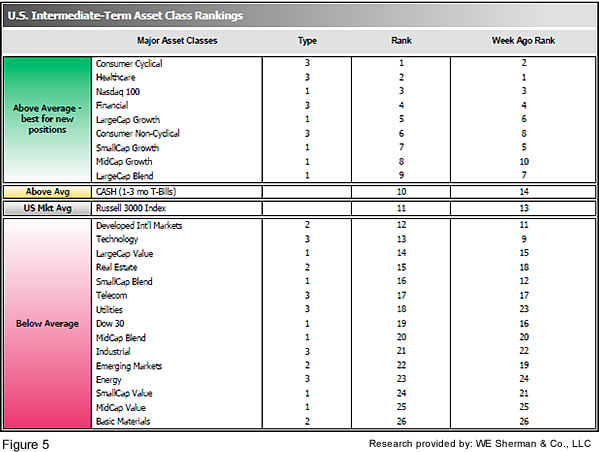
The average ranking of Defensive SHUT sectors rose to 10.8 from the prior week’s 12.3, while the average ranking of Offensive DIME sectors rose to 17.8 from the prior week’s 18.5. The Defensive SHUT sectors have maintained their lead in rankings over the Offensive DIME sectors. Note: these are “ranks”, not “scores”, so smaller numbers are higher ranks and larger numbers are lower ranks.
Summary:
The US has led the worldwide recovery, and continues to be among the strongest of global markets. However, the over-arching Secular Bear Market may remain in place globally even as new highs are reached in the US.
Because the world may still be in a Secular Bear, we have no expectations of runs of multiple double-digit consecutive years, and we expect poor market conditions to be a frequent occurrence. Nonetheless, we remain completely open to any eventuality that the market brings, and our strategies, tactics and tools will help us to successfully navigate whatever happens.
Check out the latest article in the Resource area of our website:
“Hacking and Identity Theft: A Simple Step to Better Protect Yourself

