AUG 2019: Confidence or Overconfidence?
Submitted by The Blakeley Group, Inc. on August 24th, 2019The self-made affluent have lots to tell us about how to find and work with financial professionals so we can build, maintain and use our wealth effectively. Read Four Ways the Super Rich Manage Their Wealth which can potentially have a big impact on your financial future.
~ Dick Blakeley, President/CEO
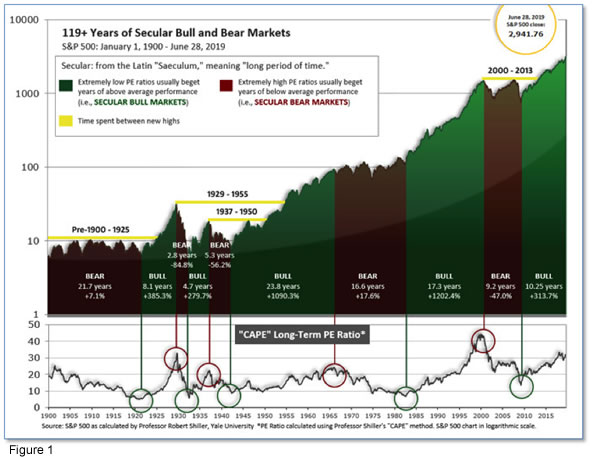
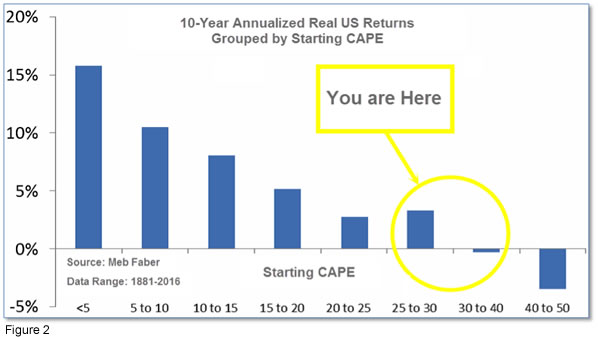
See Fig. 1 for the 100-year view of Secular Bulls and Bears. The CAPE is now at 29.66, down slightly from the prior week’s 30.86, about the level reached at the pre-crash high in October, 2007. Since 1881, the average annual return for all ten year periods that began with a CAPE around this level have been in the 0% - 3%/yr. range. (see Fig. 2).
In the big picture:
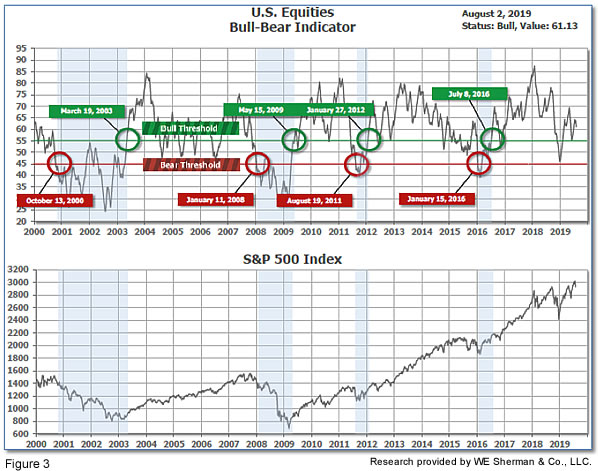
The “big picture” is the months-to-years timeframe – the timeframe in which Cyclical Bulls and Bears operate. The U.S. Bull-Bear Indicator (see Fig. 3) is in Cyclical Bull territory at 61.13, down from the prior week’s 63.77.
In the intermediate and Shorter-term picture:
The Shorter-term (weeks to months) Indicator (see Fig. 4) turned positive on June 4th. The indicator ended the week at 23, down 3 from the prior week's 26. Separately, the Intermediate-term Quarterly Trend Indicator - based on domestic and international stock trend status at the start of each quarter – was positive entering July, indicating positive prospects for equities in the third quarter of 2019.

Timeframe summary:
In the Secular (years to decades) timeframe (Figs. 1 & 2), the long-term valuation of the market is historically too high to sustain rip-roaring multi-year returns. The Bull-Bear Indicator (months to years) remains positive (Fig. 3), indicating a potential uptrend in the longer timeframe. In the intermediate timeframe, the Quarterly Trend Indicator (months to quarters) is positive for Q3, and the shorter (weeks to months) timeframe (Fig. 4) is negative. Therefore, with two indicators positive and one negative, the U.S. equity markets are rated as Positive.
In the markets:
U.S. Markets: U.S. stocks suffered their worst week of the year as investors were hit by the twin blows of disappointing signals from the Federal Reserve and the announcement of new tariffs on imports from China. Most of the markets’ declines came late in the week as both trading volumes and volatility spiked. The Dow Jones Industrial Average gave up 707 points, or -2.6%, to finish the week at 26,485. The technology-heavy NASDAQ Composite plunged -3.9% barely holding on to the 8,000 level at 8004. By market cap, the large cap S&P 500 index finished down -3.1%, while the mid caps were hardest hit, off -3.5%. The small cap Russell 2000 managed a lesser -2.9% decline.
International Markets: Like the U.S., international markets were a sea of red last week. Canada’s TSX gave up ‑1.6% while the United Kingdom’s FTSE retreated -1.9%. France’s CAC 40 plunged -4.5%, Germany’s DAX lost ‑4.4%, and Italy’s Milan FTSE finished down -3.6%. In Asia, China’s Shanghai Composite and Japan’s Nikkei each fell -2.6%. As grouped by Morgan Stanley Capital International, developed markets retreated -2.8% while emerging markets plunged -5.0%.
Commodities: Gold benefited from the weakness in equities markets, rising 2.7% to $1457.50 an ounce, but Silver finished the week down -0.8% at $16.27 an ounce. Crude oil gave up last week’s gain, finishing down -1.0% to $55.66 a barrel. The industrial metal copper, viewed by some analysts as a barometer of global economic health due to its wide variety of uses, plunged -4.2%.
July Summary: July was a modestly positive month for U.S. markets. The Dow rose 1.0% and the NASDAQ added 2.1%. The S&P 500 gained 1.3%, the mid cap S&P 400 rose 1.1%, and the small cap Russell 2000 rose the least, adding 0.5%. International markets were not so unanimously positive, however. Canada’s TSX added 0.2% and the UK’s FTSE rose 2.2%, but France’s CAC 40 gave up -0.4% and Germany’s DAX lost -1.7%. China’s Shanghai Composite retreated -1.6%, while Japan’s Nikkei rose 1.2%. Developed markets as a group gave up -2% while emerging markets as a group fell a steeper ‑2.7%. Gold rose 1.7% in July, Silver surged 8%, while oil added just 0.2%. Copper ended the month down -1.7%.
U.S. Economic News: The number of Americans claiming first-time unemployment benefits rose last week, but remained near historically low levels. The Labor Department reported initial jobless claims rose by 8,000 to 215,000. Economists had expected new claims would total 210,000. The number remains far below the key 300,000 threshold analysts use to gauge a “healthy” jobs market and near 50-year lows. The more stable monthly average of new claims fell by 1,750 to 211,500. Continuing claims, which counts the number of Americans already receiving benefits, rose by 22,000 to 1.69 million. That number is also near a 40-year low.
The Bureau of Labor Statistics reported the U.S. added 164,000 new jobs in July holding unemployment near its 50-year low of 3.7%. The strong jobs report underscored the strength of the U.S. labor market that shows little sign of deterioration despite an economy facing growing headwinds. The increase in new jobs was in line with economists’ forecasts. Analysts note, however, that the lowest unemployment rate since the late 1960’s is not generating the kind of wage increases workers used to receive when the labor market was this tight. In the past wages typically rose as much as 4% a year when unemployment was extremely low—currently wages are up just 3.2%. In the report, professional and business services led the way in hiring adding 31,000 jobs, while healthcare companies added 30,000, and social assistance providers increased by 20,000. Employment fell for sixth month in a row among retailers and media and information services also shed jobs.
Pending home sales (the number of homes in which a sales contract has been signed, but not yet closed) rose in June helped by gains in the western part of the U.S. The National Association of Realtors (NAR) reported pending home sales rose 2.8% across the country, with each of the four major regions reporting gains. Compared to the same time last year, sales were up 1.6%--their first year-over-year gain in 17 months. From the same time last year, pending home sales were up 0.9% in the Northeast, 1.7% in the Midwest, 1.4% in the South, and 2.5% in the West. Lawrence Yun, chief economist for the NAR wrote in the release, “Job growth is doing well, the stock market is near an all-time high and home values are consistently increasing. When you combine that with the incredibly low mortgage rates, it is not surprising to now see two straight months of increases.”
Despite the increase in pending homes sales, the growth in home prices slowed further in May according to the latest report from S&P CoreLogic. The Case-Shiller 20-city home price index rose 0.1% in May compared with April. On an annual basis, prices were up 2.4% compared with a 2.5% annual rate the prior month. That marks the 14th consecutive month in which the annual rise in home prices has slowed and is the slowest growth rate since August 2012. Home prices have been slowing since March of 2018 and lower mortgage rates haven’t been able to stop the trend. Reviewing some of the hot-spots, the Case Shiller report showed that Seattle home prices are down -1.2% from last year, but home prices in San Francisco and Las Vegas continued to increase—up 1% and 6.4%, respectively.
In a widely-expected move, the Federal Reserve cut interest rates this week, but the amount and the message disappointed financial markets. Stocks dropped after Fed chief Jerome Powell cut interest rates by a quarter point but implied that this might be a one-and-done deal instead of the first of several such cuts. Markets were apparently hoping for a more aggressive monetary-easing campaign. Instead, Fed Chairman Jerome Powell described the interest-rate cut, the first since the 2008 financial crisis, as a “mid-cycle adjustment” that will hopefully get the economy going again. In addition, Powell stated he didn't see the cut as the “beginning of a lengthy cutting cycle.” Markets sensed the Fed was less dovish than hoped as soon as the statement was announced, but dropped sharply once Powell rejected a large amount of easing. The Fed also said it was ending the program to shrink its balance sheet, known as quantitative tightening, on Aug. 1--two months earlier than planned.
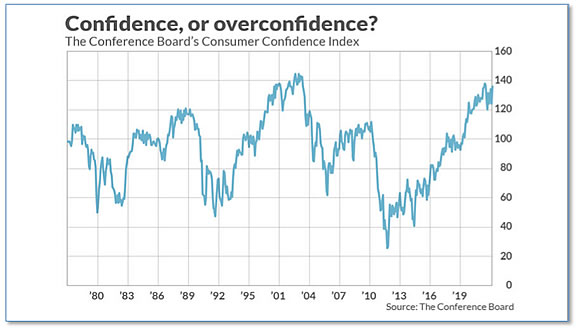
Confidence among the nation’s consumers surged to a nearly 18-year high, the Conference board reported this week. The board’s consumer confidence index jumped 11.4 points to 135.7 in July, blowing away economists’ forecasts for a reading of 126. Confidence took a dive in June after trade talks with China hit an impasse and President Trump threatened to apply tariffs to all Mexican exports in a dispute over security at the Southern border. In the details, the present situation index, a measure of how consumers view the economy right now, rose to 170.9 from 164.3. Another index that asks consumers their views of the future also advanced. Both indexes are near the highest levels of the current economic expansion that began in mid-2009. Lynn Franco, director of economic indicators at the board stated, “These high levels of confidence should continue to support robust spending in the near-term despite slower growth in GDP.”
The University of Michigan reported that the final reading of its consumer-sentiment index for July rose as well, up 0.2 point to 98.4 in July. Economists had expected a reading of 98.5. The index of consumer expectations rose while that for current conditions fell. Recent surveys have shown the most favorable personal finance expectations since late spring of 2003, but consumers have also begun to take precautionary measures to increase savings and reduce debt. Attitudes toward buying homes and vehicles have significantly receded from their cyclical peaks despite declining interest rates, the University of Michigan said.
International Economic News: Even as the U.S. Federal Reserve cut interest rates in the U.S. the Bank of Canada got further evidence that it should not do so. Canada’s economy grew by a higher-than-expected 0.2% in May—its third consecutive increase, according to data from Statistics Canada. The increase was primarily due to a rebound in manufacturing. Analysts had expected an increase of just 0.1%. Overall, 13 of the 20 industrial sectors monitored expanded in May. CIBC chief economist Avery Shenfeld noted, “The better than expected 0.2% gain in real GDP for the month leaves the economy tracking something closer to 3% growth than the Bank of Canada’s 2.3% forecast, cementing its stand-pat position on interest rates on the same day that the Fed is likely to announce an interest rate cut.” The Bank of Canada has held interest rates steady since October 2018, and is now not expected to move for the rest of the year.
Across the Atlantic, the Bank of England kept interest rates unchanged as it cut its growth forecast for this year and next to 1.3%. The BoE had previously forecast in May that output would grow by 1.5% and 1.6%, respectively, so cuts down to 1.3% are substantial. The central bank warned that Britain has a one in three chance of plunging into recession as uncertainty over Brexit drags down the economy. Its forecasts assume an orderly Brexit, which at this moment is still far from assured. Mark Carney, the BoE governor, dismissed suggestions that it was guilty of adopting the “gloomster” attitude decried by the new Prime Minister Boris Johnson. “It is clear the level of uncertainty is affecting business,” Mr. Carney said. “It is also clear there has been a substantial shortfall in investment. It is beginning to become clear that the trade response to lower sterling has begun to fade…these consequences are there.” But in contrast with the US Federal Reserve and European Central Bank, the BoE shows no signs of responding to the weakening outlook by cutting interest rates. Instead, the Monetary Policy Committee voted unanimously to hold rates at 0.75%.
In a setback for the Eurozone, France’s economy unexpectedly expanded at just 0.2% in the second quarter versus the 0.3% economists had expected. France was expected to show greater resilience as it is less exposed to the slowdown in international goods trade and more reliant on domestic demand. However, despite French President Emmanuel Macron’s $19 billion stimulus program and tax cuts, consumer spending growth continued to weaken.
For the first time ever, Germany’s longest duration bond went negative. Rates on Germany’s 30-year bunds briefly dipped to -0.002% as investors rushed to safe-haven assets this week when spooked by fears of higher trade tensions. The move meant that at one point effectively all of Germany’s debt—considered the safest in Europe—would require investors to lose money on any bond bought now and held to maturity. Analysts noted the move reflected deep pessimism about the ability of the German economy to generate growth over the coming decades and the expectations of more extreme monetary policy to come.
China slammed U.S. President Donald Trump’s decision to slap a 10% tariff on the final $300 billion worth of Chinese goods. A spokesperson for China’s Ministry of Commerce said in a statement “China will have to take necessary counter-measures”, and adding that “all the consequences will be borne by the US." However, Julian Evans-Pritchard, senior China economist at Capital Economics stated China “basically has very few good options.” "In terms of directly hitting back at the US, it's quite difficult to do it without hurting themselves." China has previously fired back with tariffs of its own on goods from the United States. It responded to Trump's last escalation in May by hiking duties on US goods worth $60 billion from 10% to 25%. However, most of the remaining American exports China hasn’t targeted yet are high-tech products that can’t be easily substituted, Evans-Pritchard stated.
Japan dropped South Korea as a preferred trading partner this week as their escalating trade dispute threatens to disrupt the global supply chain for smartphones and electronic devices. The decision to remove South Korea from a so-called white list means that Japanese exports to South Korea now require additional screening to make sure they are not used for weapons and military applications. The new restrictions go into effect August 28. South Korea's president called the decision "reckless" and promised retaliation. "If Japan — even though it has great economic strength — attempts to harm our economy, the Korean Government also has countermeasures with which to respond," President Moon Jae-in stated.
Finally: One non-obvious but historically accurate predictor of the stock market just hit its most bearish level since the internet bubble, says Marketwatch analyst Mark Hulbert. It turns out July’s big increase in consumer confidence was actually bearish for the market, since the Conference Board’s Consumer Confidence Index (CCI) is a contrarian market indicator at its extremes. In other words, extremely high values are bearish for stocks and extremely low values are bullish. The CCI stands today at its highest level in almost two decades, and that does not bode well for U.S. financial markets going forward, in Hulbert’s view. (Chart from Marketwatch.com, data from The Conference Board)
(Sources: all index return data from Yahoo Finance; Reuters, Barron’s, Wall St Journal, Bloomberg.com, ft.com, guggenheimpartners.com, zerohedge.com, ritholtz.com, markit.com, financialpost.com, Eurostat, Statistics Canada, Yahoo! Finance, stocksandnews.com, marketwatch.com, wantchinatimes.com, BBC, 361capital.com, pensionpartners.com, cnbc.com, FactSet; Figs 1-5 source W E Sherman & Co, LLC)
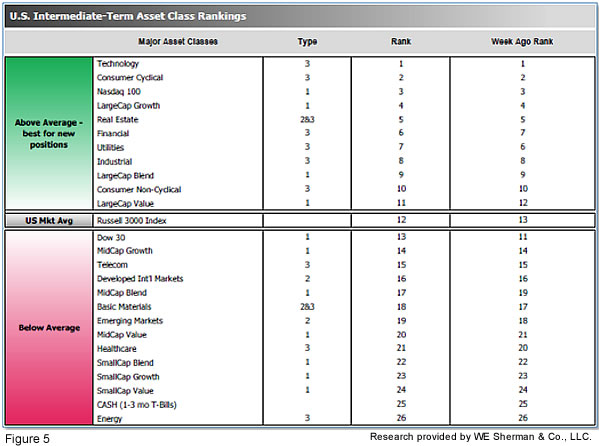
The ranking relationship (shown in Fig. 5) between the defensive SHUT ("S"=Staples [a.k.a. consumer non-cyclical], "H"=Healthcare, "U"=Utilities and "T"=Telecom) and the offensive DIME sectors ("D"=Discretionary [a.k.a. Consumer Cyclical], "I"=Industrial, "M"=Materials, "E"=Energy), is one way to gauge institutional investor sentiment in the market. The average ranking of Defensive SHUT sectors dropped to 13.25 from the prior week’s 12.75, and the average ranking of the Offensive DIME sectors fell slightly to 13.50 from the prior week at 13.25. The Defensive SHUT sectors’ continues to contract.
Note: these are “ranks”, not “scores”, so smaller numbers are higher ranks and larger numbers are lower ranks.

