APR 2022 Office Space Anyone?
Submitted by The Blakeley Group, Inc. on April 12th, 2022The very big picture (a historical perspective):
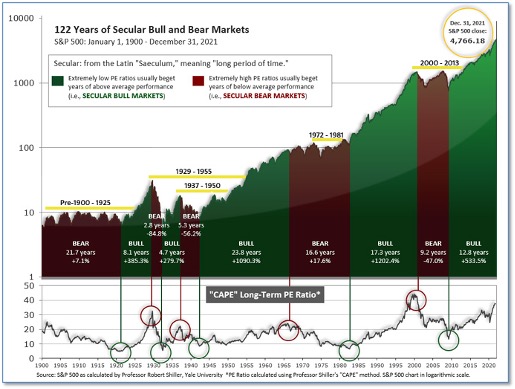
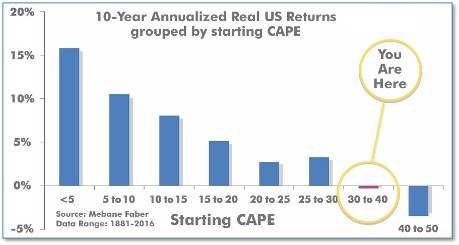
The long-term valuation of the market is commonly measured by the Cyclically Adjusted Price to Earnings ratio, or “CAPE”, which smooths-out shorter-term earnings swings in order to get a longer-term assessment of market valuation. A CAPE level of 30 is considered to be the upper end of the normal range, and the level at which further PE-ratio expansion comes to a halt (meaning that further increases in market prices only occur as a general response to earnings increases, instead of rising “just because”). The market is now above at that level.
Of course, a “mania” could come along and drive prices higher - much higher, even - and for some years to come. Manias occur when valuation no longer seems to matter, and caution is thrown completely to the wind - as buyers rush in to buy first, and ask questions later. Two manias in the last century - the “Roaring Twenties” of the 1920s, and the “Tech Bubble” of the late 1990s - show that the sky is the limit when common sense is overcome by a blind desire to buy. But, of course, the piper must be paid, and the following decade or two were spent in Secular Bear Markets, giving most or all of the mania-gains back.
The Very Big Picture: 120 Years of Secular Bulls and Bears

Figure 1
See Fig. 1 for the 100-year view of Secular Bulls and Bears. The CAPE is now at 36.83, up from the prior week’s 36.81. Since 1881, the average annual return for all ten-year periods that began with a CAPE in this range has been negative (see Fig. 2).
Note: We do not use CAPE as an official input into our methods. However, if history is any guide - and history is typically ‘some’ kind of guide - it’s always good to simply know where we are on the historic continuum, where that may lead, and what sort of expectations one may wish to hold in order to craft an investment strategy that works in any market ‘season’ … whether the current one, or one that may be ‘coming soon’!
The Very Big Picture: Historical CAPE Values
Current reading: 36.83

The big picture:
As a reading of our Bull-Bear Indicator for U.S. Equities (comparative measurements over a rolling one-year timeframe), we entered a new Cyclical Bear on March 4, 2022.
The complete picture:
Counting-up of the number of all our indicators that are ‘Up’ for U.S. Equities (see Fig. 3), the current tally is that two of four are Positive, representing a multitude of timeframes (two that can be solely days/weeks, or months+ at a time; another, a quarter at a time; and lastly, the {typically} years-long reading, that being the Cyclical Bull or Bear status).
The Current ‘Complete Picture’: The Sum of Positive Indicators.

In the markets:
U.S. Markets: The major U.S. indexes ended the week mixed, with stock prices fluctuating over the week in apparent response to the evolving situation in the war in Ukraine. The Dow Jones Industrial Average ticked down just -0.1% to 34,818, while the NASDAQ finished the week up 0.7% to 14,262. The large cap S&P 500 ticked up 0.1%, mid caps ticked down -0.1% and the small cap Russell 2000 finished the week up 0.6%.
International Markets: Most of the major international markets finished the week to the upside. Canada’s TSX ended down -0.2%, but the United Kingdom’s FTSE 100 gained 0.7%. On Europe’s mainland, France’s CAC 40 and Germany’s DAX rose 2% and 1%, respectively. In Asia, China’s Shanghai Composite snapped a five-week losing streak, rising 2.2%, but Japan’s Nikkei ended the week down -1.7%. As grouped by Morgan Stanley Capital International, developed markets rose 0.7% and Emerging markets gained 1.9%.
Commodities: It was a negative week for major commodities. Gold ended down -1.6% to $1923.70 per ounce, while Silver declined -3.8% to $24.65. Oil gave up all of last week’s gains with Brent crude declining -10.8% to $104.75 per barrel and West Texas Intermediate plunging -12.8% to $99.27. The industrial metal copper, viewed by some analysts as a barometer of world economic health due to its wide variety of uses, ended the week down -0.2%.
March Summary: Major U.S. indexes were green across the board for the month. The Dow gained 2.3% and the NASDAQ rose 3.4%. Large caps led the way with a 3.6% increase. Midcaps finished up 1.2% and small caps added 1.1%. But for the first quarter as a whole, all of the major indexes finished to the downside. The Dow shed -4.6%, while the NASDAQ plunged -9.1%. Large caps ended down -4.9%, while midcaps gave up -5.2%. Small caps ended the quarter down -7.8%.
Among major international markets for the month of March, Canada led the way with a 3.6% rise and the UK added 0.8%. France was essentially unchanged while Germany ticked down -0.3%. China gained 0.9%, while Japan gave up ‑0.6%. By grouping, developed markets added 0.5%, but emerging markets ended the month down -3.6%. International markets finished the first quarter mixed. Canada rose 3.1%, along with the UK which added 1.8%. France and Germany ended the quarter down -6.9% and -9.3%, respectively. China managed a 0.9% rise, while Japan shed -0.6%. By grouping, developed markets ended down -6.5% and emerging markets declined -7.6%.
Major commodities rose in the month of March, Gold and Silver rose 2.8% and 3.1%, respectively. Oil added 4.8% and Copper gained 6.6%. Commodities had a great first quarter of 2022. Crude oil soared 33.3%, while Gold gained 6.9%, silver added 7.6%, and the industrial metal copper rose 6.5%.
U.S. Economic News: The Labor Department reported the number of Americans filing first-time unemployment benefits rose last week, retracing much of the previous week’s sharp decline. Initial jobless claims rose by 14,000 to 202,000 in the week ended March 26. Claims had dropped by 27,000 the previous week to 188,000—its lowest level since 1969. Economists said then that the decline was too sharp to last. Economists had expected this week’s reading to rise to 195,000. Meanwhile, the number of people already collecting jobless benefits fell by 35,000 to 1.31 million. Continuing claims are at their lowest level since December of 1969.
The U.S. economy added a robust 431,000 new jobs in March and the unemployment rate ticked down closer to a half-century low, as companies pushed to add staff and more people entered the labor force. As expected, the tight labor market pushed hourly pay up a sharp 5.6% over the past year—the highest rate since the early 1980’s. For the second month in a row, a quarter of the job gains occurred in service-oriented companies such as hotels and restaurants. Employment rose by 112,000 in the hospitality business. Employment also rose by 102,000 at professional businesses, 49,000 in retail, 38,000 in manufacturing and 19,000 in construction. In addition, the percentage of people in the labor force edged up to a new pandemic high of 62.4%, just a percentage point below its pre-pandemic peak. Economists widely expect that while the labor market remains healthy, the economy should too. Robert Frick, corporate economist at Navy Federal Credit Union wrote in a note, “The March jobs report shows employment remains the best part of the economy, especially for lower-wage workers. These show an economy accelerating as the pandemic diminishes, and job levels probably reaching pre-pandemic levels this summer.”
Over 4 million workers quit their jobs in February, evidence that the labor market remains the tightest it’s been in decades. The number of people quitting topped 4 million last June for the first time ever, and it’s now happened nine months in a row in an event that’s become known as the “Great Resignation”. Before the pandemic, the number of people quitting jobs averaged fewer than 3 million a month. The so-called “quits rate” component of the labor department’s “JOLTS” report ticked up to 2.9% from 2.8%, just below an all-time high. Also in the report, the number of job openings fell slightly to 11.27 million in February, the Labor Department reported. But that number remains near a record high. Companies continue to complain of a shortage of qualified workers. Job openings rose in government, education, and services such as arts and entertainment as pandemic restrictions were eased. Openings fell in finance and manufacturing.
Home prices continued to soar in January at one of the fastest rates on record, but analysts expect higher mortgage rates to slow future growth. S&P CoreLogic reported its Case-Shiller 20-city home price index posted a 19.1% annual gain the first month of the year. On a monthly basis, the index increased 1.8% between December and January. Similarly, Case-Shiller’s national home price index showed annual growth of 19.2% in January. Craig J. Lazzara, managing director at S&P DJI, said in the Case-Shiller report, “Last fall we observed that home prices, although continuing to rise quite sharply, had begun to decelerate. Even that modest deceleration was on pause in January.” Phoenix, Ariz. recorded the highest rate of home-price growth in the country, according to the Case-Shiller report, with a 32.6% year-over-year increase. As with the month prior, two Florida cities closely followed: Tampa with a 30.8% gain and Miami with a 28.1% increase. All 20 cities that are tracked by the Case-Shiller index saw record price growth on an annual basis, and in 16 of the 20 cities the rate of home-price appreciation was higher in January than in December.
Confidence among the nation’s consumers rose for the first time this year, but concerns remain over rising inflation and the war in Ukraine. The Conference Board reported its survey of consumer confidence rose 1.7 points to 107.2 in March. The reading was a slight miss of economists’ expectations for a reading of 107.5. Overall, confidence remains well off its highs from last summer. The measure of how consumers feel about the economy right now rose by 10 points to 153.0, marking the highest point since last July. Yet a similar gauge that looks ahead six months dipped to 76.6 from 80.8, suggesting Americans are wary of the future path of the economy. Jim Baird, chief investment officer at Plante Moran Financial Advisors stated, “As the Fed embarks on what appears likely to be an extended rate hike cycle and financial conditions tighten, consumers are increasingly wary of the outlook for the economy in the latter half of the year and into 2023.”
Factory activity slowed in March hitting its lowest level in a year-and-a-half, a recent survey showed. The Institute for Supply Management reported its Purchasing Managers’ Index for manufacturing slipped 1.5 points to 57.1 in March. This is its lowest reading since September of 2020. Economists had expected a slight improvement to 59. Still, readings above 50 signify growth and this is the 22nd consecutive month the index has been above the breakeven level of 50. In the report, the new-orders index fell 7.9 points to 53.8, while the production index fell 4 points to 54.5. Despite supply-chain issues, manufacturing continues to be a solid source of strength in the economy.
International Economic News: The Canadian economy grew 0.2% in January, Statistics Canada reported. Goods-producing industries drove the gains in January, the agency said. The construction sector grew for the third time in four months—residential construction grew 4.3% in January StatCan said. The same couldn’t be said for the services sector that as a whole registered zero growth in January. CIBC senior economist Andrew Grantham wrote in an analysis that the surprisingly resilient January figure and early estimate for growth in February puts economic growth for the first quarter ahead of the growth that was anticipated at the start of the year. Grantham now expects the economy to grow at an annualized rate of 4% in the first quarter—double the forecast of Canada’s central bank.
Across the Atlantic, the United Kingdom’s economy was only 0.1% below pre-pandemic levels after growing faster than originally thought at the end of last year, the UK’s Office for National Statistics reported. UK economic output grew by 1.3% from October to December, compared with an initial estimate of 1.0%. Revisions to estimated growth in 2021 and 2020 mean the economy is now thought to have ended 2021 just 0.1% shy of its pre-Covid-19 level, compared with a previous estimate of 0.4%. However, some analysts noted increased government spending made up much of the shortfall and growth remained well off the trend that would have been expected before the pandemic began.
On Europe’s mainland, inflation in France jumped more than expected with consumer prices rising 5.1% from the same time last year. Economists had expected inflation to come in at 4.9%. The ramp-up in euro-zone prices is heaping pressure on the European Central Bank to raise interest rates from record lows. But while some ECB officials are pushing for one or more hikes this year, President Christine Lagarde has stressed the need for a gradual approach amid “significant risks” to economic growth. France has tried to insulate its citizens from the increase in oil and gas prices by imposing caps on gas and electricity prices this year.
Germany’s Economy Minister Robert Habeck stated Germany “will be poorer” because of Russia’s assault on Ukraine, as soaring energy prices hit Europe’s biggest economy particularly hard. "It is not possible that this ends without costs for German society, it is unthinkable," Robert Habeck said. Preliminary figures indicate that inflation hit 7.3% in March, according to the country's Federal Statistics Office. That's the highest level in more than 40 years. The German government indicated that its payments dispute with Russia--which has demanded that "unfriendly" nations pay in rubles for their natural gas rather than in euros or US dollars--could lead to shortages, and ultimately rationing.
In Asia, China renewed its criticism of Western sanctions against Russia as European Union officials sought assurances from Beijing that it would not help Russia circumvent the economic restrictions imposed in response to its invasion of Ukraine. The Chinese Foreign Ministry also laid blame for the war in Ukraine at least partially on the United States for pushing to expand the NATO military alliance closer to Russia’s borders. China’s Foreign Ministry spokesperson Zhao Lijian earlier warned that his country “disapproves of solving problems through sanctions, and we are even more opposed to unilateral sanctions and long-arm jurisdiction that have no basis in international law.” China says it is not taking sides in the conflict, but it has declared a “no limits” partnership with Russia and refuses to condemn the invasion.
Japan "does not intend to withdraw" from oil and liquefied natural gas development projects in Russia, Trade Minister Koichi Hagiuda stated this week. Japanese companies have invested in the Sakhalin-1, Sakhalin-2 and Arctic LNG 2 (ARC 2) projects. Each has been deemed essential to Japan's energy security. "We have interest in them and have secured long-term claimants," said Hagiuda.. "In the current situation of sudden energy price increases, we can procure energy at prices cheaper than the market price. This is extremely important for energy security."
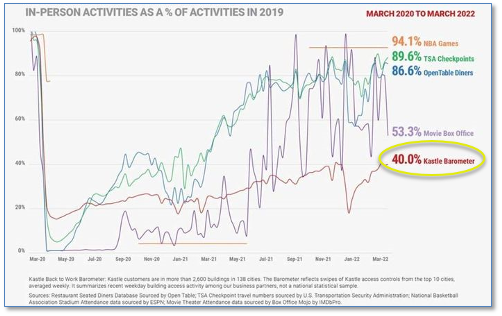
Finally: As the pandemic winds down, life in many respects is almost back to normal—except for one area—office space. According to building security provider Kastle, which monitors the use of security and ID cards in office buildings, the “Kastle Barometer” of average weekly occupancy for offices is still just 40% of pre-pandemic levels. In contrast, the NBA is reporting attendance just 6% down from 2019 levels, and the TSA is reporting air traffic down 11%. Nicholas Colas, co-founder of DataTrek Resources, attributes the stagnation to multiple factors. Not only did the pandemic show businesses that, in many cases, its office functions could be performed online, but the current labor market has given employees a strong upper hand in the job market. “Many businesses want their workers back in the office but know that pushing the issue risks increasing labor force turnover. Many workers want – and can demand – flexible work schedules where they continue to work from home some or all of the time,” he said. (Chart by Kastle Systems)

(Sources: All index- and returns-data from Yahoo Finance; news from Reuters, Barron’s, Wall St. Journal, Bloomberg.com, ft.com, guggenheimpartners.com, zerohedge.com, ritholtz.com, markit.com, financialpost.com, Eurostat,0020Statistics Canada, Yahoo! Finance, stocksandnews.com, marketwatch.com, wantchinatimes.com, BBC, 361capital.com, pensionpartners.com, cnbc.com, FactSet.)

