2018 Capital Highlights - In the Markets Archives
2017 Capital Highlights Archives
Dec 2018: About that October-November swoon
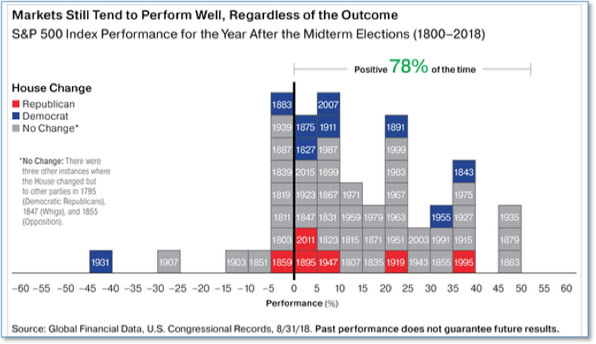
Many investors fear that if Republicans lose control of the House it would derail President Trump’s pro-business agenda and bring an end to the current historic bull market. However, the Oppenheimer report showed that of the 15 times that the House changed the party in control at midterm elections, 12 (or 80%) of the following years were positive, and that overall 78% of the years following midterm elections were positive.
Read More
Nov 2018: Historical view on Mid-market Election
Many investors fear that if Republicans lose control of the House it would derail President Trump’s pro-business agenda and bring an end to the current historic bull market. However, the Oppenheimer report showed that of the 15 times that the House changed the party in control at midterm elections, 12 (or 80%) of the following years were positive, and that overall 78% of the years following midterm elections were positive.
Read More
Oct 2018: Remember All Those Predictions?
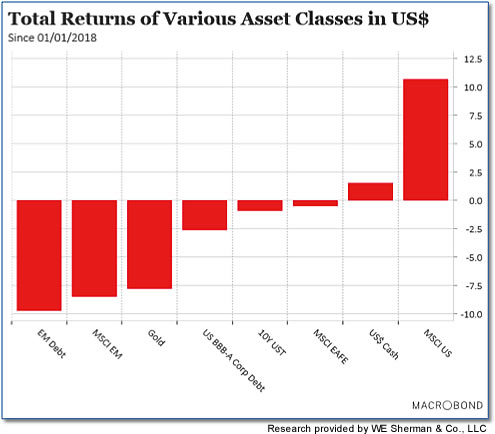
Remember all those predictions that Emerging Markets (both stocks and bonds) would be the breakout winners of 2018? Ooops. U.S. investors are to be forgiven for thinking that 2018 so far is yet another good year in the current long-running bull market, because it is – for them. But as the chart below from research firm Macrobond shows, the U.S. is pretty much alone. Even U.S. bond investors are modestly underwater for 2018 through Q3. And Emerging Market debt and equity? Fuggedaboudit – they are deeply in the red.
Read More
Sept 2018: U.S. Stocks Retreat After Record Highs
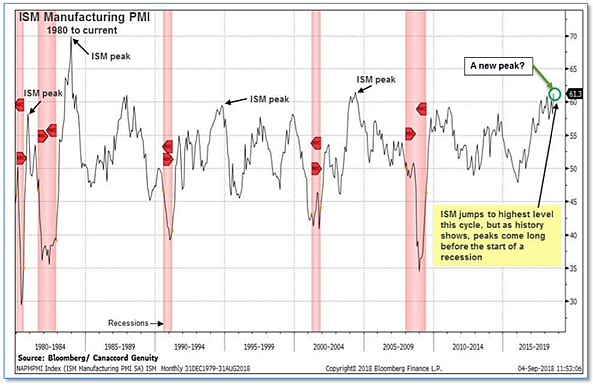
Nine years into the current bull market more and more are beginning to wonder “how much longer can it go on?” Tony Dwyer, equity strategist at Canaccord Genuity, reiterated his S&P 500 target of 3,200 for the end of this year (a nearly 11% rise from current levels), based on the strong manufacturing report this week. Dwyer went further and projected the index to rise to 3,360 in 2019, highlighting his view that a recession isn’t lurking “anywhere close”.
Read More
Aug 2018: Warren Buffett’s Favorite Metric
Legendary investor Warren Buffett’s favorite metric of stock valuations is currently suggesting that a stock market setback could be coming. While anything from Buffett brings up memories of the television commercials from the 1970’s that with the tag line “When E.F. Hutton talks, people listen”, Buffett’s favorite indicator is both historically effective and remarkably simple to calculate.
Read More
July 2018: Extremes in Market Turnover
Analysts are beginning to take note of a concerning development in the market— extremes in market turnover. Trading is through the roof in many major market indexes and across asset classes. In the S&P 500 index alone, investors traded more than $2.9 trillion worth of shares since the beginning of the year—a level last seen in early 2008, right before the financial crisis really hit. JP Morgan Chase strategist Nikolaos Panigirtzoglou wrote in a note, “Market turnover tends to be high when uncertainty is high, as institutional investors continuously reshuffle their portfolios. Negative growth revisions coupled with political and policy risks including the Italian crisis and trade war risks are creating a lot more uncertainty this year relative to last year.”
June 2018: May was a Strong Month for U.S. Markets
May was a strong month for U.S. markets, with the Dow Jones Industrial Average adding 1.1% and the Nasdaq Composite surging 5.3%. By market cap, the large cap S&P 500 added 2.2%, the mid cap S&P 400 rose 4.0%, and the small cap Russell 2000 vaulted 5.9%. Canada’s TSX rose 2.9%, while in Europe the UK’s FTSE added 2.2%. Major markets on Europe’s mainland finished the month lower with France’s CAC 40 down -2.2%, Germany’s DAX off -0.1%, and Italy’s Milan FTSE plunging -9.2%. In Asia, China’s Shanghai Composite added 0.4% while Japan’s Nikkei retreated -1.2%. For the month, developed markets retreated -1.9%, and emerging markets fell -2.6%. Gold fell for a second consecutive month by slipping -1.6%, while silver managed a gain of 0.3%. Crude oil finished the month down -2.1%, and copper finished May off -0.3%. U.S.
May 2018: U.S. Trade Deficit Fell
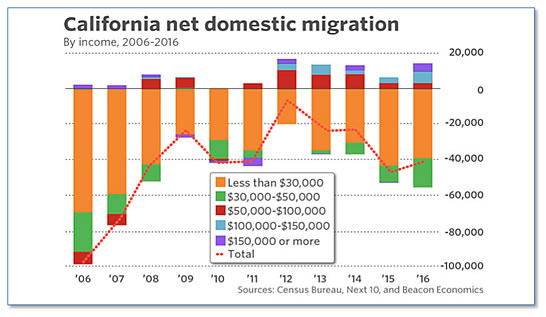
Most people leaving the state earn $50,000 or less per year. And while California is a still a net importer of highly educated professionals in the information, professional, and technical sectors that can afford the higher cost of homes, the accommodation, construction, manufacturing, and retail trade sectors are experiencing a huge exodus. Who will be left to serve drinks and food, turn down the sheets, build and clean the houses of all those software engineers?
April 2018: High-Flying Technology Sector Lagged
U.S. stocks recovered a portion of the previous week’s steep losses, but the high-flying technology sector lagged the other benchmarks in this partial recovery. The Dow Jones Industrial Average climbed 570 points to close at 24,103, a gain of 2.4%. The technology-heavy NASDAQ Composite added 70 points to end the week at 7,063, a 1.0% rise. By market cap, the large cap S&P 500 index rebounded 2.0%, the mid cap S&P 400 index gained 2.1%, and the small cap Russell 2000 index rose 1.3%.
March 2018: U.S. Stocks Were Down

Canada’s TSX gave up last week’s gains and then some by falling -1.6%. Across the Atlantic, major markets were deep in the red. The United Kingdom’s FTSE fell -2.4%, while on Europe’s mainland, France’s CAC 40 dropped -3.4%, and Germany’s DAX plunged -4.6%. Italy’s Milan FTSE plunged -3.4%. In Asia, China’s Shanghai Composite gave up just -1.1%, compared to Japan’s Nikkei which fell -3.3%. Hong Kong’s Hang Seng finished the week down -2.2%. As grouped by Morgan Stanley Capital International, developed markets fell -2.7%, while emerging markets fell -3.2%.
February 2018: Investors Pour $33.2B into Stock-based Funds

Precious metals turned out to be of little value as a safe haven amid the market weakness. Gold retreated -1.1% to $1337.30 an ounce, while Silver plunged -4.2% to $16.71 an ounce. Energy was also weak, as oil traded down -1% to $65.45 per barrel of West Texas Intermediate crude oil. Copper, which some analysts use as an indicator of global economic health due to its variety of uses, fell just -0.4%.
January 2018: Strong Start for US Markets

Manufacturing activity surged last month, according to the latest data from the Institute for Supply Management (ISM) manufacturing index. The ISM index rose 1.5 points to 59.7—the second highest reading in a year. The uptick in the index exceeded analysts’ expectations. In the details, sixteen of the eighteen industries tracked reported growth. Production rose 1.9 points to 65.8, while new orders jumped 5.4 points to 69.4--its fastest pace since January 2004. The only weak spot in the report was in the employment index which saw a slight drop to 57 from 59.7. Manufacturing is likely to get a boost this year from the $1.5 trillion tax cut approved by the Republican-controlled U.S. Congress last month. Manufacturing accounts for about 12% of the U.S. economy.

